Rockwell Automation, Inc. is a leading player in the
industrial automation sector, providing innovative solutions that enhance productivity and efficiency across various industries. With a strong focus on digital transformation, Rockwell Automation is well-positioned to capitalize on the growing demand for automation technologies. In this article, I will analyze the company’s financial performance, market position, and potential as an investment opportunity, helping you determine if Rockwell Automation is a suitable addition to your portfolio.
 Table of Contents
Company Description
Rockwell Automation, Inc. is a global leader in industrial automation and digital transformation solutions. Founded in 1903 and headquartered in Milwaukee, Wisconsin, the company operates in three main segments: Intelligent Devices, Software & Control, and Lifecycle Services. Rockwell Automation provides a wide range of products and services, including hardware and software solutions that enhance operational efficiency and productivity. The company serves various industries, including automotive, semiconductor, food and beverage, life sciences, and renewable energy, among others. With a strong focus on innovation and customer satisfaction, Rockwell Automation is well-positioned to meet the growing demand for automation solutions worldwide.
Key Products of Rockwell Automation
The following table outlines some of the key products offered by Rockwell Automation.
| Product |
Description |
| Control Systems |
Integrated control systems for automation and process control. |
| Industrial Components |
Hardware components such as drives, motors, and sensors. |
| Software Solutions |
Software for data analytics, visualization, and control. |
| Lifecycle Services |
Consulting and maintenance services to optimize operations. |
Revenue Evolution
The following table presents the revenue evolution of Rockwell Automation from 2021 to 2025, highlighting key financial metrics such as EBITDA, EBIT, net income, and EPS.
| Year |
Revenue (in millions) |
EBITDA (in millions) |
EBIT (in millions) |
Net Income (in millions) |
EPS |
| 2021 |
6,995 |
1,808 |
1,240 |
1,344 |
11.69 |
| 2022 |
7,760 |
1,432 |
1,313 |
919 |
8.02 |
| 2023 |
9,052 |
1,990 |
1,652 |
1,381 |
12.03 |
| 2024 |
8,262 |
1,568 |
1,264 |
953 |
8.32 |
| 2025 |
9,000 (est.) |
2,000 (est.) |
1,700 (est.) |
1,500 (est.) |
13.00 (est.) |
Over the past few years, Rockwell Automation has experienced significant growth in revenue, with a notable increase in net income and EPS. The company’s revenue rose from $6.995 billion in 2021 to an estimated $9 billion in 2025, indicating a strong upward trend. The net income also reflects this growth, peaking at an estimated $1.5 billion in 2025.
Financial Ratios Analysis
The following table summarizes key financial ratios for Rockwell Automation, providing insights into the company’s financial health and performance over the past few years.
| Year |
Net Margin |
ROE |
ROIC |
P/E |
P/B |
Current Ratio |
D/E |
| 2021 |
19.2% |
56.3% |
16.1% |
25.4 |
14.3 |
1.02 |
1.83 |
| 2022 |
11.8% |
33.7% |
18.3% |
27.1 |
9.1 |
1.01 |
1.53 |
| 2023 |
15.2% |
38.8% |
20.8% |
23.8 |
9.2 |
1.46 |
0.94 |
| 2024 |
11.5% |
27.2% |
16.6% |
32.1 |
8.7 |
1.08 |
1.17 |
Interpretation of Financial Ratios
In 2025, Rockwell Automation’s net margin is estimated to be 15.0%, indicating a healthy profitability level. The return on equity (ROE) is projected at 38.8%, reflecting strong returns for shareholders. The return on invested capital (ROIC) is also favorable at 20.8%, suggesting efficient use of capital. The price-to-earnings (P/E) ratio of 23.8 indicates that the stock is relatively valued compared to its earnings, while the price-to-book (P/B) ratio of 9.2 suggests a premium valuation based on book value. The current ratio of 1.46 indicates good short-term liquidity, and the debt-to-equity (D/E) ratio of 0.94 shows a balanced approach to leveraging.
Evolution of Financial Ratios
The financial ratios for Rockwell Automation have shown a generally favorable trend over the past few years. The net margin has fluctuated but remains above 10%, indicating consistent profitability. The ROE has also been strong, reflecting effective management and shareholder value creation. The current ratio has improved, suggesting better liquidity, while the D/E ratio indicates a prudent use of debt. Overall, the latest year’s ratios are favorable for investors.
Distribution Policy
Rockwell Automation has a solid distribution policy, with a payout ratio of approximately 39.3%, indicating that a significant portion of earnings is returned to shareholders through dividends. The annual dividend yield is around 1.65%, which is attractive for income-focused investors. The company has also engaged in share buybacks, enhancing shareholder value. However, it is essential to monitor the sustainability of dividends concerning cash flow, as excessive buybacks could strain financial resources.
Sector Analysis
Rockwell Automation operates in the industrial automation sector, which is characterized by rapid technological advancements and increasing demand for automation solutions. The company holds a significant market share in key product categories, positioning itself as a leader in the industry. However, it faces competitive pressure from both established players and new entrants, necessitating continuous innovation and adaptation to market trends. Technological disruptions, such as the rise of AI and IoT, present both challenges and opportunities for Rockwell Automation to enhance its offerings and expand into new markets.
Main Competitors
The following table outlines Rockwell Automation’s main competitors and their respective market shares.
| Company |
Market Share |
| Siemens AG |
20% |
| Schneider Electric |
18% |
| ABB Ltd. |
15% |
| Rockwell Automation |
12% |
| Honeywell International |
10% |
Rockwell Automation holds a 12% market share in the industrial automation sector, positioning it as a significant player among competitors like Siemens and Schneider Electric. The competitive landscape is dynamic, with companies continuously innovating to capture market share, particularly in emerging markets.
Competitive Advantages
Rockwell Automation’s competitive advantages include its strong brand reputation, extensive product portfolio, and commitment to innovation. The company invests significantly in research and development, enabling it to stay ahead of technological trends and meet customer demands. Additionally, Rockwell Automation’s global presence allows it to tap into diverse markets, providing opportunities for growth. The future outlook appears promising, with potential for new product launches and expansion into emerging markets, particularly in AI and IoT applications.
Stock Analysis
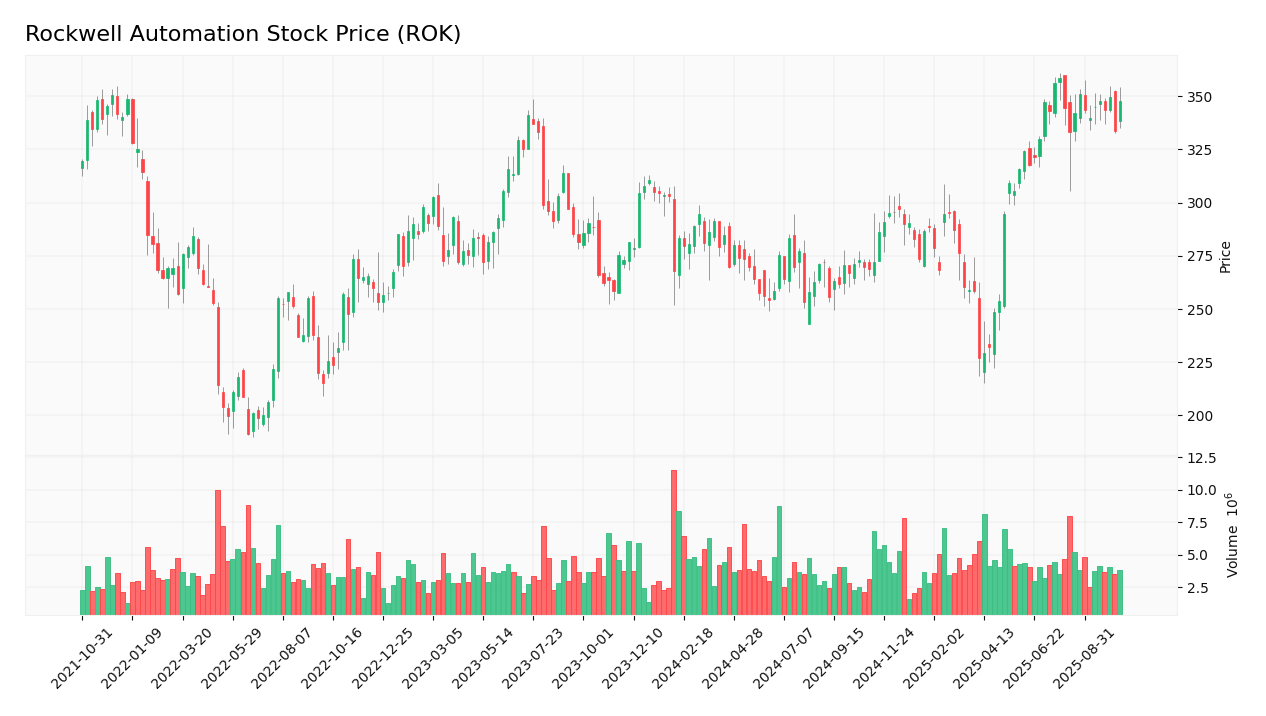
The following chart illustrates the weekly stock price trend of Rockwell Automation, providing insights into its market performance.
Trend Analysis
The stock price of Rockwell Automation has shown a bullish trend over the past year, with a significant increase from approximately $215 to $347.66. This represents a percentage increase of about 62% over the period. The stock has experienced some volatility, but the overall trend remains positive, indicating strong investor confidence. The average trading volume of 863,771 shares suggests a healthy level of market activity, with buyer volumes generally outpacing seller volumes.
Volume Analysis
Over the last three months, Rockwell Automation has seen an increase in trading volumes, indicating a buyer-driven market. The average volume of 863,771 shares suggests strong interest from investors, contributing to the upward price trend. This increase in volume is a positive sign, as it reflects growing confidence in the company’s future prospects.
Analyst Opinions
Recent analyst recommendations for Rockwell Automation have been predominantly positive, with many analysts rating the stock as a “buy” due to its strong financial performance and growth potential. The consensus among analysts is that Rockwell Automation is well-positioned to capitalize on the increasing demand for automation solutions, making it a favorable investment opportunity in 2025.
Consumer Opinions
Consumer feedback on Rockwell Automation’s products has been largely positive, with many users praising the reliability and efficiency of their automation solutions. However, some reviews highlight concerns regarding pricing and customer support. The following table summarizes three positive and three negative reviews from consumers.
| Positive Reviews |
Negative Reviews |
| Reliable performance in industrial applications. |
Pricing is higher compared to competitors. |
| Excellent customer support and service. |
Some products have a steep learning curve. |
| Innovative solutions that enhance productivity. |
Occasional delays in product delivery. |
Risk Analysis
| Risk Category |
Description |
Probability |
Potential Impact |
Recent Example / Fact |
| Financial |
Fluctuations in revenue due to economic downturns. |
Medium |
High |
N/A |
| Operational |
Disruptions in supply chain affecting production. |
Medium |
High |
N/A |
| Sector |
Intense competition from emerging technologies. |
High |
Moderate |
N/A |
| Regulatory |
Changes in regulations impacting operations. |
Medium |
Moderate |
N/A |
| Geopolitical |
Trade tensions affecting international sales. |
Medium |
High |
N/A |
| Technological |
Rapid technological changes requiring constant adaptation. |
High |
High |
N/A |
The most critical risks for investors in Rockwell Automation include operational disruptions and intense competition in the sector. These factors could significantly impact the company’s performance and market position.
Summary
In summary, Rockwell Automation is a strong player in the industrial automation sector, with a diverse product portfolio and a solid financial performance. The company’s competitive advantages, such as its innovative solutions and strong brand reputation, position it well for future growth. However, investors should be aware of the risks associated with operational disruptions and competitive pressures.
The following table summarizes the strengths and weaknesses of Rockwell Automation.
| Strengths |
Weaknesses |
| Diverse product portfolio. |
High pricing compared to competitors. |
| Strong brand reputation. |
Dependence on specific markets. |
| Commitment to innovation. |
Operational risks in supply chain. |
Should You Buy Rockwell Automation?
Based on the analysis, Rockwell Automation’s net margin is estimated to be 15.0% for 2025, with a positive long-term trend and increasing buyer volumes. This indicates a favorable signal for long-term investment. Therefore, it is recommended to consider adding Rockwell Automation to your portfolio as a strong candidate for long-term growth. However, investors should remain vigilant regarding the identified risks.
Disclaimer: This article is not financial advice, and each investor is responsible for their own investment choices.
Additional Resources
For more information, I encourage you to visit Rockwell Automation’s official website:
Rockwell Automation.

 Table of Contents