Snap Inc. (SNAP) has been a significant player in the social media landscape, primarily known for its innovative camera application, Snapchat. With a focus on visual communication, Snap has continually evolved its offerings to engage users and advertisers alike. In this article, I will analyze Snap’s financial health, market position, and potential as an investment opportunity. By the end, you will have a clearer understanding of whether Snap is a suitable addition to your investment portfolio.
 Table of Contents
Company Description
Snap Inc. operates as a camera company, primarily known for its flagship product, Snapchat, which allows users to communicate visually through images and short videos. Founded in 2010 and headquartered in Santa Monica, California, Snap has expanded its offerings to include augmented reality (AR) advertising and Spectacles, smart eyewear that captures photos and videos from a first-person perspective. The company primarily serves markets in North America and Europe, positioning itself within the Internet Content & Information industry. Snap’s innovative approach to social media has made it a unique player in a competitive landscape dominated by larger tech firms.
Key Products of Snap
Below is a table summarizing Snap’s key products and their descriptions.
| Product |
Description |
| Snapchat |
A multimedia messaging app that allows users to send photos and videos that disappear after being viewed. |
| Spectacles |
Smart eyewear that captures photos and videos from the user’s perspective, integrating with Snapchat. |
| AR Ads |
Augmented reality advertisements that allow users to interact with brands in a more immersive way. |
| Snap Ads |
Video ads that appear between user-generated content on Snapchat. |
Revenue Evolution
The following table illustrates Snap’s revenue evolution, including key financial metrics from 2021 to 2025.
| Year |
Revenue (in millions) |
EBITDA (in millions) |
EBIT (in millions) |
Net Income (in millions) |
EPS |
| 2021 |
4,117 |
-338 |
-702 |
-488 |
-0.31 |
| 2022 |
4,602 |
-1,177 |
-1,395 |
-1,429 |
-0.89 |
| 2023 |
4,606 |
-1,104 |
-1,398 |
-1,322 |
-0.82 |
| 2024 |
5,361 |
-493 |
-787 |
-698 |
-0.42 |
| 2025 |
N/A |
N/A |
N/A |
N/A |
N/A |
Over the past four years, Snap’s revenue has shown a steady increase, reaching $5.36 billion in 2024. However, the company has consistently reported negative net income, indicating ongoing challenges in profitability. The EPS has also been negative, reflecting the company’s struggle to convert revenue into profit.
Financial Ratios Analysis
The following table presents key financial ratios for Snap from 2021 to 2024, providing insights into its financial health.
| Year |
Net Margin |
ROE |
ROIC |
P/E |
P/B |
Current Ratio |
D/E |
| 2021 |
-0.1185 |
-0.1287 |
-0.1050 |
-150.26 |
19.34 |
5.70 |
0.69 |
| 2022 |
-0.3107 |
-0.5540 |
-0.2048 |
-10.07 |
5.58 |
4.32 |
1.62 |
| 2023 |
-0.2871 |
-0.5478 |
-0.2046 |
-20.64 |
11.31 |
4.39 |
1.80 |
| 2024 |
-0.1302 |
-0.2848 |
-0.1176 |
-25.61 |
7.29 |
3.95 |
1.73 |
Interpretation of Financial Ratios
In 2024, Snap’s net margin improved slightly but remained negative at -13.02%. The return on equity (ROE) and return on invested capital (ROIC) also reflected negative values, indicating that the company is not generating sufficient returns for its shareholders. The price-to-earnings (P/E) ratio is notably high, suggesting that investors are paying a premium for the stock despite the lack of profitability. The current ratio of 3.95 indicates a strong liquidity position, while the debt-to-equity (D/E) ratio of 1.73 suggests a relatively high level of debt compared to equity.
Evolution of Financial Ratios
The financial ratios for Snap have shown mixed trends over the past few years. While the current ratio has remained above 3, indicating good liquidity, the net margin and profitability ratios have consistently been negative. The latest year’s ratios suggest that while Snap is managing its short-term obligations well, it still faces significant challenges in achieving profitability. Overall, the financial ratios indicate a need for improvement in operational efficiency and cost management.
Distribution Policy
Snap does not currently pay dividends, as indicated by a payout ratio of 0. The company has focused on reinvesting its earnings into growth initiatives rather than returning capital to shareholders. This strategy may be appropriate given the company’s ongoing challenges in achieving profitability. However, the lack of dividends may deter income-focused investors. Additionally, Snap has not engaged in significant share buybacks, which could have provided some support to the stock price.
Sector Analysis
Snap operates within the highly competitive social media and digital advertising sector. The company faces significant competition from larger players like Meta and TikTok, which have substantial market shares and resources. Despite this, Snap has carved out a niche with its unique features and user engagement strategies. The company must continuously innovate to maintain its market position and fend off competitive pressures.
Main Competitors
The following table outlines Snap’s main competitors and their respective market shares.
| Company |
Market Share |
| Meta (Facebook, Instagram) |
60% |
| TikTok |
25% |
| Snap Inc. |
10% |
| Twitter |
5% |
Snap’s main competitors dominate the market, with Meta holding a significant share. However, Snap’s unique features and focus on visual communication provide it with a competitive edge, particularly among younger demographics. The company must continue to innovate and adapt to changing consumer preferences to maintain its market position.
Competitive Advantages
Snap’s competitive advantages include its strong brand identity, innovative features like AR filters, and a loyal user base. The company has opportunities to expand its product offerings and enter new markets, particularly in augmented reality and e-commerce. By leveraging its technology and user engagement, Snap can enhance its market position and drive future growth.
Stock Analysis
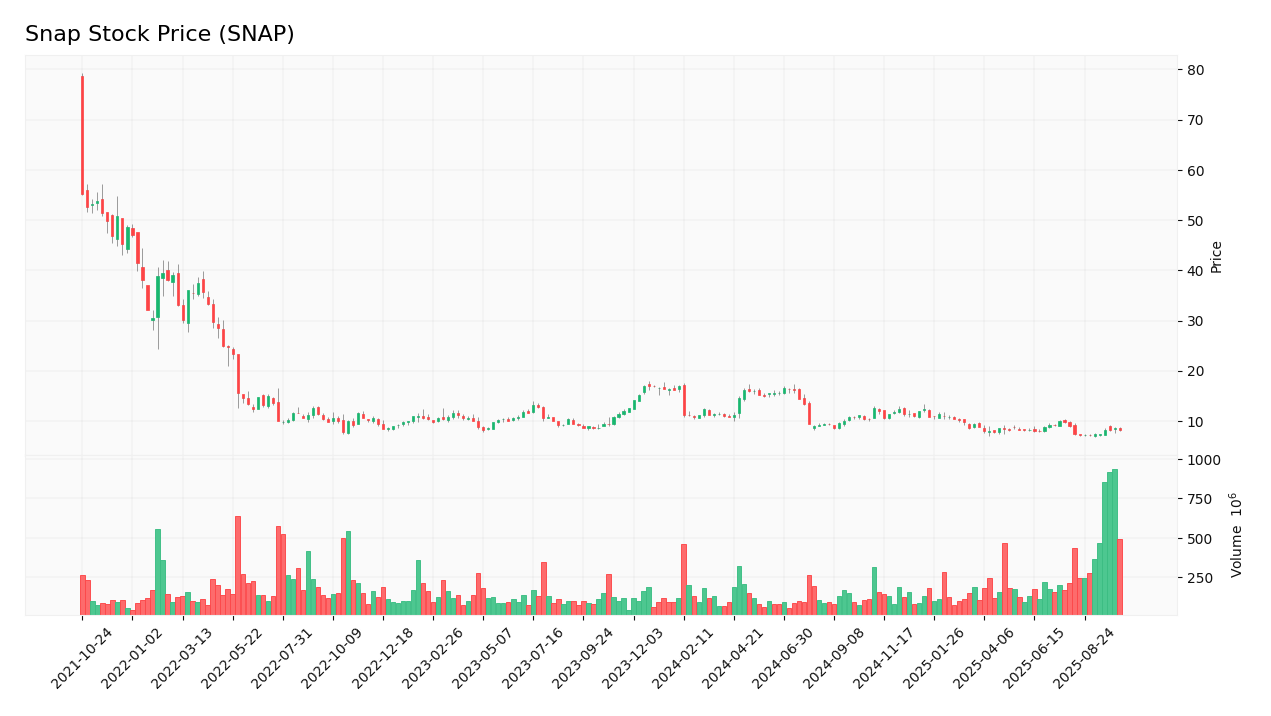
The following chart illustrates Snap’s stock price trend over the past year, providing insights into its market performance.
Trend Analysis
Over the past year, Snap’s stock has experienced significant volatility, with a price range between $6.90 and $13.28. Currently, the stock is trading at $8.09, reflecting a bearish trend with a recent decline of 0.29%. The stock’s beta of 0.712 indicates lower volatility compared to the market, suggesting that it may be less sensitive to market fluctuations. The overall trend appears bearish, and investors should exercise caution. The stock has seen a percentage decrease of approximately 38% over the past year, indicating a challenging environment for the company.
Volume Analysis
The average trading volume for Snap is approximately 91 million shares per day. Over the last three months, trading volumes have shown an increasing trend, indicating heightened interest from investors. This increase in volume suggests that the market is currently more buyer-driven, which could signal potential upward momentum if sustained. However, the overall market sentiment remains cautious due to the company’s ongoing challenges.
Analyst Opinions
Recent analyst recommendations for Snap have been mixed, with some analysts suggesting a “hold” rating while others advocate for a “buy” based on potential growth opportunities. The consensus appears to lean towards a cautious “hold” as the company navigates its profitability challenges. Analysts emphasize the need for Snap to improve its financial performance before it can be considered a strong buy.
Consumer Opinions
Consumer feedback on Snap has been generally positive, particularly regarding its innovative features and user engagement. However, some users have expressed concerns about the app’s usability and the frequency of updates. The following table compares three positive and three negative reviews of Snap.
| Positive Reviews |
Negative Reviews |
| Innovative features keep the app fresh and engaging. |
Frequent updates can disrupt user experience. |
| Strong community and user base. |
Some features are difficult to navigate. |
| Great for visual communication and creativity. |
Concerns about privacy and data security. |
Risk Analysis
| Risk Category |
Description |
Probability |
Potential Impact |
Recent Example / Fact |
| Financial |
Ongoing losses affecting cash flow and profitability. |
High |
High |
N/A |
| Operational |
Challenges in maintaining user engagement and app functionality. |
Medium |
Moderate |
N/A |
| Sector |
Intense competition from larger social media platforms. |
High |
High |
N/A |
| Regulatory |
Potential changes in data privacy laws affecting operations. |
Medium |
Moderate |
N/A |
| Technological |
Rapid technological changes requiring constant innovation. |
High |
High |
N/A |
The most critical risks for investors in Snap include financial instability due to ongoing losses and intense competition in the sector. These factors could significantly impact the company’s future performance and stock value. Investors should remain vigilant regarding these risks.
Summary
In summary, Snap Inc. has established itself as a unique player in the social media landscape with innovative products and a strong user base. However, the company faces significant challenges in achieving profitability, as reflected in its financial ratios and ongoing losses. The competitive landscape remains fierce, and Snap must continue to innovate to maintain its market position.
The following table summarizes Snap’s strengths and weaknesses.
| Strengths |
Weaknesses |
| Innovative product offerings. |
Consistent financial losses. |
| Strong brand identity. |
High competition in the sector. |
| Loyal user base. |
Dependence on advertising revenue. |
Should You Buy Snap?
Given Snap’s negative net margin and ongoing challenges, it is advisable to wait for improvements in its fundamentals before considering an investment. The current bearish trend and seller-driven volumes suggest that potential investors should exercise caution and monitor the situation closely. Key risks include financial instability and competitive pressures, which could impact future performance.
Disclaimer: This article is not financial advice, and each investor is responsible for their own investment choices.
Additional Resources
- Snap Inc. (SNAP) Faces Class Action Over Ad Platform, Investors Allege Misleading Statements
- Q3 2025 Results Call November 5 — Snap to webcast live; replay available ninety days
- Digital Marketing Market Global Forecast 2025-2030, Profiles of Alphabet, Meta, Amazon, ByteDance, Tencent, Microsoft, Baidu, Snap, Pinterest, The Trade Desk
- Snap Inc. (SNAP): A Bull Case Theory
For more information about Snap, visit their official website: Snap Inc..

 Table of Contents