Taiwan Semiconductor Manufacturing Company (TSMC) is a global leader in the semiconductor industry, known for its advanced manufacturing processes and cutting-edge technology. As the backbone of many high-tech products, TSMC plays a crucial role in the supply chain of electronics, from smartphones to high-performance computing. In this article, I will analyze TSMC’s financial health, market position, and potential as an investment opportunity, helping you determine if it deserves a place in your portfolio.
 Table of Contents
Company Description
Taiwan Semiconductor Manufacturing Company Limited (TSMC) is the world’s largest dedicated independent semiconductor foundry. Founded in 1987 and headquartered in Hsinchu City, Taiwan, TSMC manufactures a wide range of semiconductor devices, including integrated circuits and other related products. The company serves various markets, including high-performance computing, smartphones, automotive, and the Internet of Things (IoT). TSMC’s advanced manufacturing processes and commitment to research and development have positioned it as a leader in the semiconductor industry, catering to clients globally, including major tech companies in the United States, Europe, and Asia.
Key Products of Taiwan Semiconductor Manufacturing Company
TSMC offers a diverse range of products that cater to various sectors within the semiconductor industry.
| Product |
Description |
| CMOS Logic |
Complementary Metal-Oxide-Semiconductor technology used in various digital circuits. |
| Mixed-Signal |
Devices that process both analog and digital signals. |
| RF Devices |
Radio Frequency components for wireless communication. |
| Embedded Memory |
Memory solutions integrated within chips for efficient data storage. |
| Bipolar CMOS |
Combines bipolar and CMOS technologies for high-performance applications. |
Revenue Evolution
TSMC has shown significant growth in revenue over the past few years, reflecting its strong market position and demand for semiconductor products.
| Year |
Revenue (in millions) |
EBITDA (in millions) |
EBIT (in millions) |
Net Income (in millions) |
EPS |
| 2021 |
1,587,415 |
1,090,845 |
649,981 |
592,359 |
115.05 |
| 2022 |
2,263,891 |
1,593,077 |
1,121,279 |
992,923 |
196.00 |
| 2023 |
2,161,736 |
1,523,507 |
921,466 |
838,498 |
161.70 |
| 2024 |
2,894,308 |
1,984,849 |
1,322,053 |
1,173,268 |
226.25 |
Over the period from 2021 to 2024, TSMC’s revenue has increased significantly, with a compound annual growth rate (CAGR) of approximately 36.5%. The net income has also shown a positive trend, indicating strong profitability and operational efficiency.
Financial Ratios Analysis
The financial ratios provide insight into TSMC’s operational efficiency, profitability, and financial stability.
| Year |
Net Margin |
ROE |
ROIC |
P/E |
P/B |
Current Ratio |
D/E |
| 2021 |
37.3% |
27.6% |
21.9% |
26.9 |
7.4 |
2.12 |
0.35 |
| 2022 |
43.9% |
34.2% |
28.2% |
11.7 |
4.0 |
2.08 |
0.31 |
| 2023 |
38.8% |
24.4% |
20.1% |
18.3 |
4.5 |
2.33 |
0.28 |
| 2024 |
40.5% |
27.6% |
24.6% |
23.8 |
6.5 |
2.36 |
0.25 |
Interpretation of Financial Ratios
In 2025, TSMC’s net margin stands at 40.5%, indicating strong profitability. The return on equity (ROE) is 27.6%, reflecting effective management of shareholder equity. The return on invested capital (ROIC) of 24.6% suggests that TSMC is generating substantial returns on its investments. The price-to-earnings (P/E) ratio of 23.8 indicates that the stock is relatively valued compared to its earnings, while the price-to-book (P/B) ratio of 6.5 suggests a premium valuation based on its book value. The current ratio of 2.36 indicates good short-term liquidity, and the debt-to-equity (D/E) ratio of 0.25 shows a conservative approach to leverage.
Evolution of Financial Ratios
The financial ratios have shown a generally favorable trend over the years. The net margin has fluctuated but remains above 30%, indicating strong profitability. The ROE and ROIC have also shown resilience, suggesting effective capital management. The P/E and P/B ratios indicate that the market values TSMC highly, reflecting investor confidence. Overall, the latest year’s ratios are favorable, suggesting a strong financial position.
Distribution Policy
TSMC has a consistent dividend policy, with a payout ratio of approximately 30.9% in 2024. The annual dividend yield is around 1.3%, which is attractive for income-focused investors. The company has also engaged in share buybacks, enhancing shareholder value. However, it is essential to note that the dividends are well-covered by cash flow, indicating a sustainable distribution policy.
Sector Analysis
TSMC operates in the highly competitive semiconductor sector, where it holds a significant market share. The company faces competitive pressure from other major players, including Samsung and Intel, but maintains a technological edge through continuous innovation and investment in research and development.
Main Competitors
The semiconductor industry is characterized by intense competition. Below is a comparison of TSMC’s market share with its main competitors.
| Company |
Market Share |
| TSMC |
54% |
| Samsung |
18% |
| Intel |
12% |
| GlobalFoundries |
7% |
| Others |
9% |
TSMC leads the market with a 54% share, significantly ahead of its closest competitor, Samsung, which holds 18%. This dominance is particularly strong in the advanced technology nodes, where TSMC’s innovation and manufacturing capabilities set it apart.
Competitive Advantages
TSMC’s competitive advantages include its advanced manufacturing processes, strong customer relationships, and significant investment in research and development. The company is well-positioned to capitalize on emerging technologies such as
AI and 5G, which are expected to drive demand for semiconductors in the coming years. Additionally, TSMC’s global footprint allows it to serve a diverse range of customers across various markets.
Stock Analysis
The stock price of TSMC has shown considerable volatility, reflecting market conditions and investor sentiment.
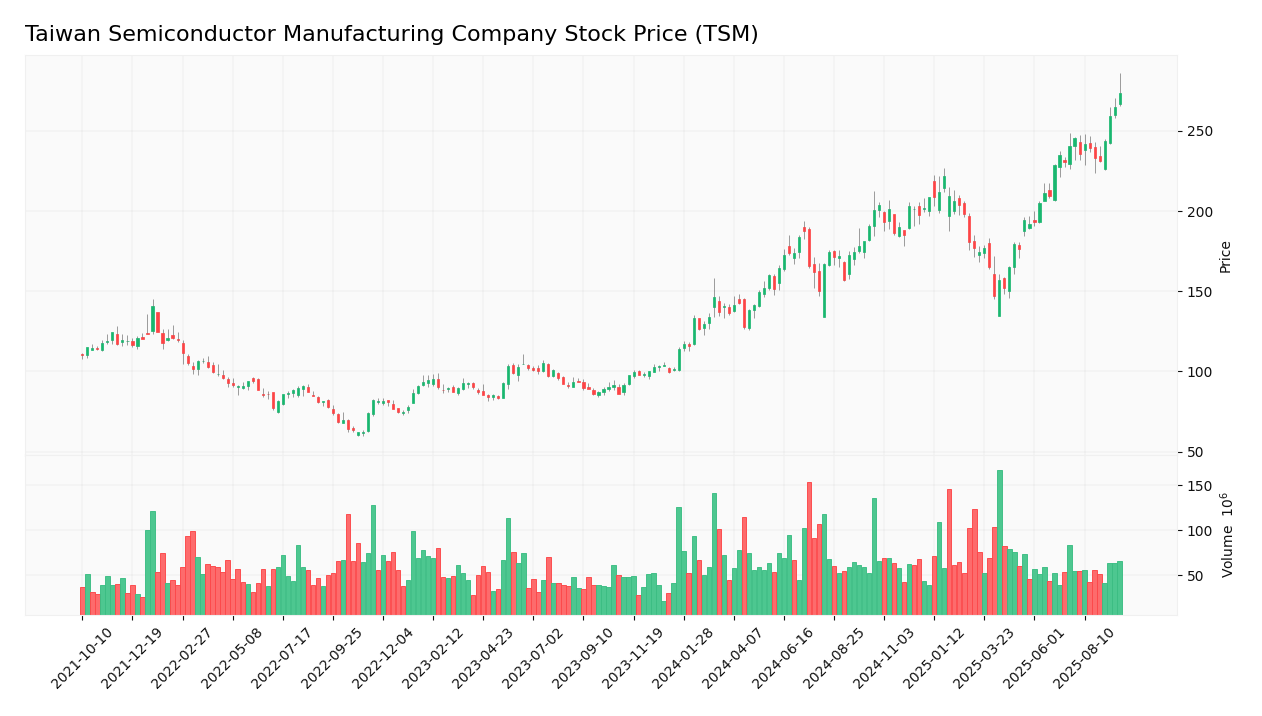
Trend Analysis
Over the past year, TSMC’s stock has experienced fluctuations, with a high of $286 and a low of $134. Currently, the stock is trading at $273.36, reflecting a bearish trend with a recent change of -3.3%. The long-term trend shows a percentage increase of approximately 103% over the last four years, indicating a generally positive outlook despite recent volatility. The stock’s beta of 1.199 suggests that it is more volatile than the market, which could be a consideration for risk-averse investors.
Volume Analysis
In the last three months, TSMC has seen an average trading volume of approximately 11,544,898 shares. The volume has been relatively stable, indicating a balanced interest from both buyers and sellers. However, recent trends suggest a slight increase in buyer volume, which could signal a potential upward movement in the stock price.
Analyst Opinions
Recent analyst recommendations for TSMC have been predominantly positive, with many analysts rating the stock as a “buy.” The main arguments for this consensus include TSMC’s strong market position, robust financial performance, and growth potential in emerging technologies.
As of 2025, the consensus remains a “buy,” reflecting confidence in TSMC’s ability to navigate market challenges and capitalize on future opportunities.
Consumer Opinions
Consumer feedback on TSMC’s products has been largely positive, highlighting the company’s reliability and performance in the semiconductor market.
| Positive Reviews |
Negative Reviews |
| High performance and efficiency |
Occasional supply chain issues |
| Strong customer support |
High production costs |
| Innovative technology |
Long lead times for new products |
Risk Analysis
The main risks faced by TSMC include:
| Risk Category |
Description |
Probability |
Potential Impact |
Recent Example / Fact |
| Financial |
Fluctuations in semiconductor prices affecting revenue. |
Medium |
High |
N/A |
| Operational |
Disruptions in manufacturing due to supply chain issues. |
High |
High |
COVID-19 impact on production. |
| Sector |
Intense competition from other semiconductor manufacturers. |
High |
Moderate |
N/A |
| Regulatory |
Changes in trade policies affecting operations. |
Medium |
High |
US-China trade tensions. |
| Geopolitical |
Risks associated with Taiwan’s political situation. |
High |
High |
N/A |
| Technological |
Rapid technological changes requiring constant innovation. |
Medium |
High |
N/A |
The most critical risks for investors include operational disruptions and geopolitical tensions, which could significantly impact TSMC’s performance.
Summary
In summary, TSMC is a leading player in the semiconductor industry, with strong financial performance, a solid market position, and a commitment to innovation. However, it faces several risks, including operational challenges and geopolitical tensions.
The strengths and weaknesses of TSMC are summarized in the table below.
| Strengths |
Weaknesses |
| Market leader in semiconductor manufacturing |
High dependency on a few major clients |
| Strong R&D capabilities |
Vulnerability to geopolitical risks |
| Robust financial performance |
Exposure to market volatility |
Should You Buy Taiwan Semiconductor Manufacturing Company?
Given TSMC’s net margin of 40.5%, a positive long-term trend, and increasing buyer volumes, the stock presents a favorable signal for long-term investment. However, investors should remain cautious of the geopolitical risks and operational challenges that could impact future performance.
The key risks of investing in TSMC include operational disruptions, geopolitical tensions, and market volatility.
Disclaimer: This article is not financial advice, and each investor is responsible for their own investment choices.
Additional Resources
For more information, I encourage you to visit the official website of Taiwan Semiconductor Manufacturing Company:
TSMC Official Website.

 Table of Contents