Home > Analyses > Technology > Fabrinet
Fabrinet revolutionizes the optical and electro-mechanical manufacturing landscape, powering the backbone of modern communication networks and advanced technology industries. As a key player in precision optical packaging and electronic manufacturing, Fabrinet is renowned for its cutting-edge solutions that enable high-speed data transmission and sophisticated sensor applications. With a strong global footprint and relentless innovation, the company’s future growth potential invites a thorough examination of whether its current valuation aligns with its robust fundamentals.

Table of contents
Business Model & Company Overview
Fabrinet, founded in 1999 and headquartered in Grand Cayman, operates as a leading provider in the hardware and precision optical manufacturing sector. Its integrated ecosystem spans optical packaging, electro-mechanical assembly, and advanced testing services, serving OEMs across optical communications, industrial lasers, automotive, and medical industries. This cohesive approach underpins Fabrinet’s dominant position in delivering complex, high-precision components worldwide.
The company’s revenue engine balances sophisticated manufacturing services with a global footprint covering North America, Asia-Pacific, and Europe. Fabrinet’s value creation hinges on combining process design, supply chain management, and advanced assembly to support high-speed optical and electronic applications. Its competitive advantage lies in its ability to scale and innovate across multiple technology domains, reinforcing a durable economic moat that shapes the future of optical and sensor manufacturing.
Financial Performance & Fundamental Metrics
This section analyzes Fabrinet’s income statement, key financial ratios, and dividend payout policy to assess its overall financial health and investment appeal.
Income Statement
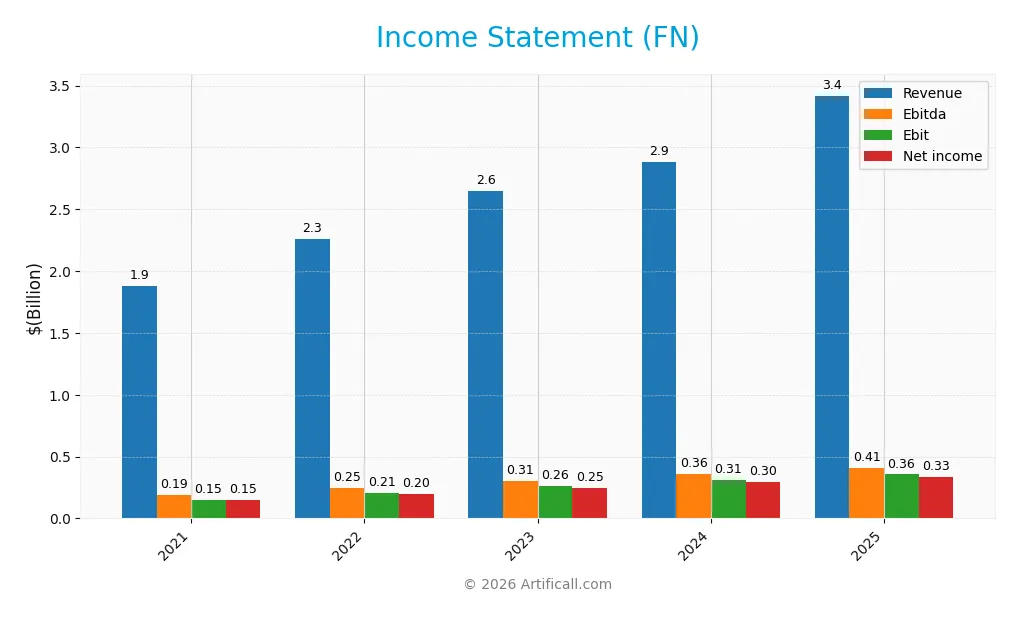
The table below summarizes Fabrinet’s key income statement figures for the fiscal years 2021 through 2025, reported in USD.
| 2021 | 2022 | 2023 | 2024 | 2025 | |
|---|---|---|---|---|---|
| Revenue | 1.88B | 2.26B | 2.65B | 2.88B | 3.42B |
| Cost of Revenue | 1.66B | 1.98B | 2.31B | 2.53B | 3.01B |
| Operating Expenses | 70.6M | 74.1M | 84.6M | 78.5M | 88.9M |
| Gross Profit | 221M | 279M | 336M | 356M | 413M |
| EBITDA | 188M | 246M | 305M | 360M | 409M |
| EBIT | 152M | 207M | 262M | 311M | 355M |
| Interest Expense | 1.1M | 0.4M | 1.5M | 0.1M | 0 |
| Net Income | 148M | 200M | 248M | 296M | 333M |
| EPS | 4.02 | 5.43 | 6.79 | 8.17 | 9.23 |
| Filing Date | 2021-08-17 | 2022-08-16 | 2023-08-22 | 2024-08-20 | 2025-08-19 |
Income Statement Evolution
From 2021 to 2025, Fabrinet’s revenue rose significantly by 81.94%, with the latest fiscal year showing an 18.6% increase. Gross profit followed a similar positive trend, growing 16.07% in the last year and supporting a stable gross margin around 12.09%, which is considered neutral. EBIT and net income also expanded notably, with EBIT margin favorable at 10.39% and net margin improving by 23.21% over the period.
Is the Income Statement Favorable?
In 2025, Fabrinet reported revenue of 3.42B USD and net income of 333M USD, reflecting solid fundamentals. EBIT grew by 14.03% year-over-year, and EPS increased by 13.21%, indicating operational efficiency and earnings growth. Despite a slight dip in net margin by 5.34% last year, the overall income statement is rated favorable, with low interest expenses and strong margin expansions supporting this view.
Financial Ratios
The table below presents key financial ratios for Fabrinet (FN) over the fiscal years 2021 to 2025, highlighting profitability, valuation, liquidity, leverage, and efficiency metrics:
| Ratios | 2021 | 2022 | 2023 | 2024 | 2025 |
|---|---|---|---|---|---|
| Net Margin | 7.9% | 8.9% | 9.4% | 10.3% | 9.7% |
| ROE | 13.3% | 16.0% | 16.9% | 17.0% | 16.8% |
| ROIC | 12.5% | 15.1% | 15.9% | 14.8% | 15.0% |
| P/E | 23.7 | 15.3 | 19.1 | 30.0 | 32.0 |
| P/B | 3.16 | 2.45 | 3.23 | 5.08 | 5.37 |
| Current Ratio | 3.04 | 2.83 | 3.43 | 3.61 | 3.00 |
| Quick Ratio | 2.09 | 1.80 | 2.35 | 2.78 | 2.28 |
| D/E | 4.1‰ | 24.8‰ | 9.1‰ | 2.9‰ | 2.8‰ |
| Debt-to-Assets | 2.8% | 1.7% | 0.7% | 0.2% | 0.2% |
| Interest Coverage | 137x | 473x | 171x | 2239x | 0 |
| Asset Turnover | 1.16 | 1.23 | 1.34 | 1.23 | 1.21 |
| Fixed Asset Turnover | 7.58 | 7.63 | 8.48 | 9.22 | 8.85 |
| Dividend Yield | 0% | 0% | 0% | 0% | 0% |
Evolution of Financial Ratios
Over the analyzed period, Fabrinet’s Return on Equity (ROE) displayed a steady improvement, reaching 16.78% in 2025, indicating enhanced profitability. The Current Ratio remained robust around 3.0, reflecting stable liquidity. Meanwhile, the Debt-to-Equity Ratio consistently stayed near zero, showing minimal reliance on debt. Profitability margins also showed relative stability with slight fluctuations in net margin.
Are the Financial Ratios Favorable?
In 2025, Fabrinet’s financial ratios present a generally favorable profile, with strong profitability (ROE 16.78%, ROIC 15.01%), excellent liquidity (current ratio 3.0, quick ratio 2.28), and very low leverage (debt-to-equity near zero). Efficiency ratios such as asset and fixed asset turnover are also favorable. However, valuation multiples like P/E (32.02) and P/B (5.37) are viewed as unfavorable, and the zero dividend yield is a negative aspect. Overall, most ratios indicate financial strength.
Shareholder Return Policy
Fabrinet (FN) does not pay dividends, reflecting its reinvestment strategy and focus on sustaining growth. The company maintains strong profitability with net profit margins near 9–10% and generates significant free cash flow, but opts to retain earnings rather than distribute them.
No share buyback programs are reported, indicating a preference for capital retention over returning cash to shareholders. This policy aligns with a long-term value creation approach, emphasizing financial stability and investment in operations rather than immediate shareholder payouts.
Score analysis
The radar chart below illustrates Fabrinet’s key financial ratios and valuation metrics for a comprehensive view:
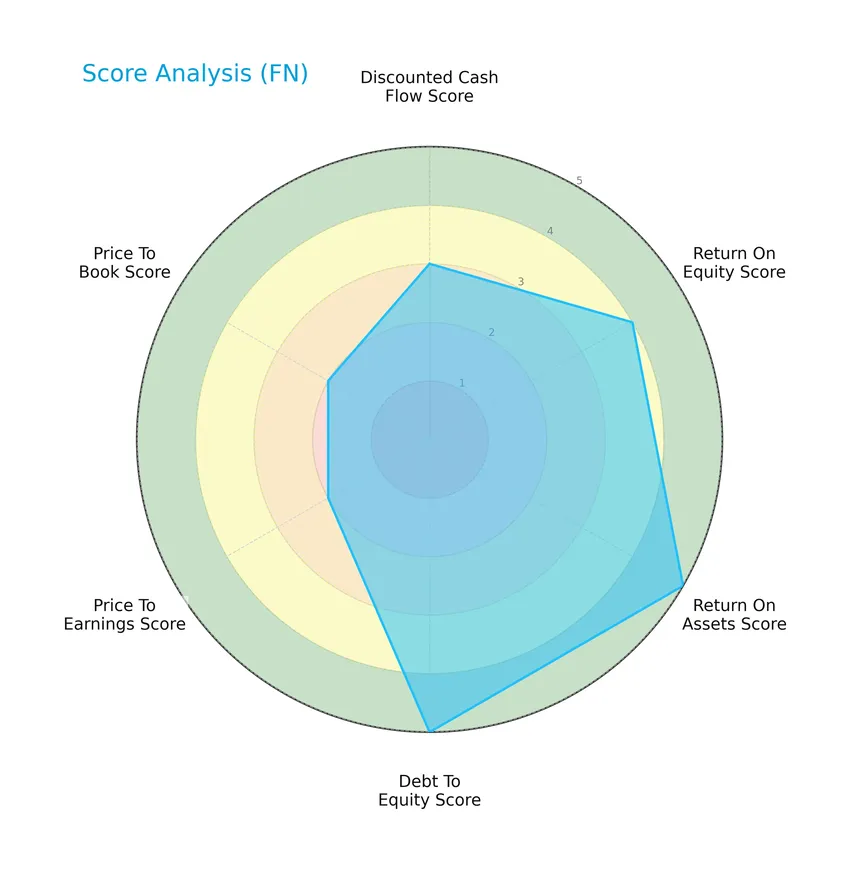
Fabrinet shows a moderate discounted cash flow score of 3 and favorable returns with a return on equity score of 4 and a very favorable return on assets score of 5. Its debt to equity score is also very favorable at 5, while valuation metrics such as price to earnings and price to book scores are moderate at 2 each.
Analysis of the company’s bankruptcy risk
Fabrinet’s Altman Z-Score places it well within the safe zone, indicating a low risk of bankruptcy:

Is the company in good financial health?
The Piotroski Score diagram provides insights into Fabrinet’s financial health based on nine key criteria:

With a Piotroski Score of 4, Fabrinet is considered to have average financial health, reflecting moderate strength in profitability, leverage, liquidity, and efficiency indicators.
Competitive Landscape & Sector Positioning
This sector analysis will explore Fabrinet’s strategic positioning, revenue by segment, key products, main competitors, and competitive advantages. I will examine whether Fabrinet holds a competitive advantage relative to its peers in the technology hardware and equipment industry.
Strategic Positioning
Fabrinet has a diversified geographic presence, generating substantial revenue across Asia Pacific (1.66B in 2025), North America (1.48B), and Europe (282M). Its product portfolio focuses primarily on optical communications (2.62B in 2025) with additional contributions from lasers, sensors, and related technologies, reflecting a concentrated yet technologically advanced market position.
Revenue by Segment
The pie chart illustrates Fabrinet’s revenue distribution by segment for the fiscal year 2025, highlighting the company’s business focus and segment contributions.
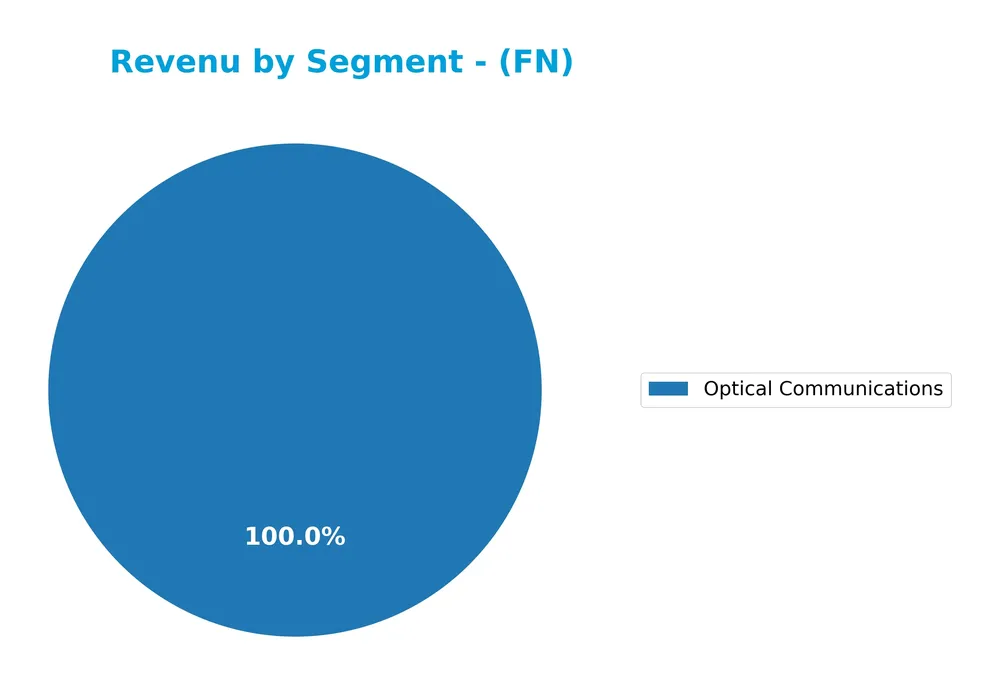
Optical Communications remains the dominant revenue driver, growing from $2B in 2023 to $2.62B in 2025, showing steady acceleration. The Lasers, Sensors, and Other segment contributed significantly in prior years but is no longer reported separately in 2025. This concentration in Optical Communications suggests Fabrinet is strengthening its core market, though investors should watch for potential risks tied to this dependence.
Key Products & Brands
The table below outlines Fabrinet’s main products and brands along with their descriptions:
| Product | Description |
|---|---|
| Optical Communications | Includes switching products like reconfigurable optical add-drop multiplexers, optical amplifiers, modulators, transceivers, transponders, and active optical cables for data centers and network connectivity. |
| Lasers, Sensors, And Other | Comprises solid state, diode-pumped, gas, and fiber lasers for semiconductor processing, biotechnology, and medical devices; differential pressure, micro-gyro, fuel sensors for automotive; and non-contact temperature sensors for medical use. |
| Custom Optical Components | Application-specific crystals, lenses, prisms, mirrors, laser components, substrates, and various borosilicate and fused silica glass products designed and fabricated for OEMs in optical communications, industrial lasers, automotive, medical, and sensor industries. |
Fabrinet specializes in advanced manufacturing services for optical communications and laser-based technologies, serving diverse sectors including telecommunications, industrial, automotive, and medical industries.
Main Competitors
There are 20 competitors in the sector, with the table below listing the top 10 leaders by market capitalization:
| Competitor | Market Cap. |
|---|---|
| Amphenol Corporation | 171B |
| Corning Incorporated | 77.7B |
| TE Connectivity Ltd. | 68.6B |
| Sandisk Corporation | 40B |
| Garmin Ltd. | 38.9B |
| Keysight Technologies, Inc. | 35.5B |
| Celestica Inc. | 34B |
| Coherent, Inc. | 28.7B |
| Jabil Inc. | 25.7B |
| Teledyne Technologies Incorporated | 24.4B |
Fabrinet ranks 13th among 20 competitors, with a market cap about 9.78% that of the leading company, Amphenol Corporation. The company is positioned below both the average market cap of the top 10 competitors, which is 54.4B, and the sector’s median market cap of 21.6B. Fabrinet is 11.41% smaller than its closest competitor above it in the ranking, highlighting a moderate gap in scale.
Comparisons with competitors
Check out how we compare the company to its competitors:
Does Fabrinet have a competitive advantage?
Fabrinet presents a competitive advantage, as evidenced by its ROIC exceeding WACC by over 6%, coupled with a significant ROIC growth trend of nearly 20% from 2021 to 2025. This indicates efficient use of invested capital and a strong ability to create value with durable profitability.
Looking ahead, Fabrinet’s exposure to advanced optical manufacturing and its diverse global footprint in Asia-Pacific, North America, and Europe position it well to capitalize on growing demand for optical communication components and industrial lasers. Continued innovation and expansion in these markets offer potential opportunities to sustain its competitive edge.
SWOT Analysis
This SWOT analysis aims to provide a clear overview of Fabrinet’s strategic position to guide investment decisions.
Strengths
- strong revenue growth of 18.6% in 2025
- high ROIC of 15.01% exceeding WACC
- diversified global manufacturing footprint
Weaknesses
- high P/E ratio of 32.02 indicating possible overvaluation
- moderate Piotroski score of 4 signaling average financial strength
- no dividend yield for income investors
Opportunities
- expanding demand for optical and electro-mechanical components
- growth in Asia-Pacific and North American markets
- increasing adoption of advanced manufacturing technologies
Threats
- intense competition in the hardware and optical sectors
- supply chain disruptions impacting manufacturing
- technological obsolescence risk
Fabrinet demonstrates a robust growth profile and competitive advantage through increasing profitability and operational efficiency. However, valuation metrics and moderate financial strength suggest caution. The company’s strategy should focus on leveraging growth opportunities while managing competitive and technological risks effectively.
Stock Price Action Analysis
The weekly stock chart for Fabrinet (FN) over the past 12 months illustrates notable price fluctuations and trend developments:
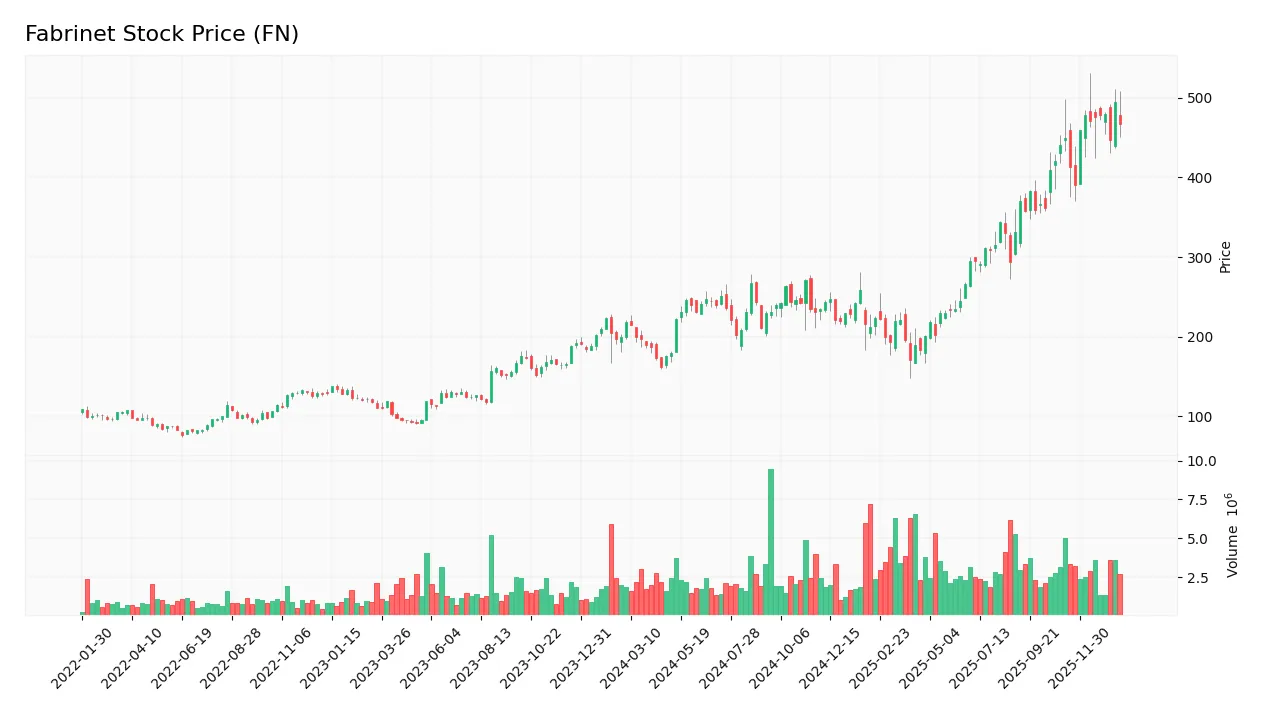
Trend Analysis
Over the past 12 months, Fabrinet’s stock price increased by 113.59%, indicating a bullish trend with clear acceleration. The price ranged between a low of 162.32 and a high of 494.45, accompanied by a high volatility level of 87.91 standard deviation, reflecting significant price swings during this period.
Volume Analysis
Trading volume has been increasing, with buyers accounting for 53.96% of total activity, suggesting a buyer-driven market. In the recent three-month period, buyer dominance slightly increased to 55.75%, indicating growing investor confidence and stronger market participation favoring demand over supply.
Target Prices
The target price consensus for Fabrinet (FN) reflects a positive outlook among analysts.
| Target High | Target Low | Consensus |
|---|---|---|
| 600 | 537 | 569 |
Analysts expect Fabrinet’s stock to trade between $537 and $600, with a consensus target around $569, indicating moderate upside potential.

Don’t Let Luck Decide Your Entry Point
Optimize your entry points with our advanced ProRealTime indicators. You’ll get efficient buy signals with precise price targets for maximum performance. Start outperforming now!
Analyst & Consumer Opinions
This section examines recent analyst ratings and consumer feedback regarding Fabrinet’s market performance and product reception.
Stock Grades
The following table presents recent verified analyst grades for Fabrinet, reflecting the company’s current market evaluation:
| Grading Company | Action | New Grade | Date |
|---|---|---|---|
| Susquehanna | Maintain | Positive | 2026-01-22 |
| Barclays | Upgrade | Overweight | 2026-01-14 |
| Barclays | Maintain | Equal Weight | 2025-11-05 |
| Needham | Maintain | Buy | 2025-11-04 |
| JP Morgan | Maintain | Overweight | 2025-11-04 |
| Rosenblatt | Maintain | Buy | 2025-11-04 |
| JP Morgan | Maintain | Overweight | 2025-10-16 |
| Rosenblatt | Maintain | Buy | 2025-10-02 |
| JP Morgan | Upgrade | Overweight | 2025-08-25 |
| Needham | Maintain | Buy | 2025-08-19 |
The overall trend shows consistent positive sentiment, with multiple upgrades and maintained buy or overweight ratings indicating sustained confidence among leading analysts. No sell or strong sell grades have been reported.
Consumer Opinions
Fabrinet’s customer base expresses a mix of enthusiasm and concern, reflecting a nuanced view of the company’s performance and product quality.
| Positive Reviews | Negative Reviews |
|---|---|
| High-quality optical components with reliable performance. | Occasional delays in order fulfillment reported. |
| Strong customer support with responsive service teams. | Pricing can be higher compared to competitors. |
| Consistent innovation in fiber optic technologies. | Limited availability of certain custom solutions. |
Overall, consumers appreciate Fabrinet’s product quality and customer service, while noting issues with delivery times and pricing as areas for improvement.
Risk Analysis
Below is a concise overview of key risks associated with Fabrinet (FN), highlighting probability and potential impact for investors:
| Category | Description | Probability | Impact |
|---|---|---|---|
| Market Valuation | Elevated P/E (32.02) and P/B (5.37) ratios suggest overvaluation risk if growth slows | Medium | High |
| Industry Cyclicality | Exposure to hardware and optical components markets prone to demand fluctuations | Medium | Medium |
| Geopolitical Risk | Operations span North America, Asia-Pacific, Europe; supply chain and regulatory challenges exist | Medium | Medium |
| Dividend Policy | No dividend payout may deter income-focused investors and increase stock volatility | High | Low |
| Financial Health | Strong Altman Z-Score (14.23) indicates low bankruptcy risk, but average Piotroski Score (4) | Low | Low |
Fabrinet’s most pressing risks stem from valuation levels and geopolitical exposures affecting its global supply chain. Despite favorable financial health metrics, market shifts could trigger price corrections. Caution is advised given moderate probability and impact of industry and regional risks.
Should You Buy Fabrinet?
Fabrinet appears to be demonstrating robust profitability supported by a durable competitive moat with growing value creation, while its leverage profile remains manageable. Despite moderate valuation metrics, the overall financial health could be seen as very favorable with an A- rating.
Strength & Efficiency Pillars
Fabrinet exhibits a robust financial profile, underscored by a favorable return on equity (ROE) of 16.78% and a solid return on invested capital (ROIC) of 15.01%, comfortably surpassing its weighted average cost of capital (WACC) at 8.72%. This differential confirms Fabrinet as a clear value creator. The company’s Altman Z-Score of 14.23 places it well within the safe zone, indicating strong financial health and low bankruptcy risk. Additionally, an average Piotroski score of 4 suggests moderate financial strength, balanced by a very favorable debt-to-equity ratio of 0.0 and a current ratio of 3.0, which reinforces solid liquidity and risk management.
Weaknesses and Drawbacks
Despite these strengths, Fabrinet faces valuation headwinds with a high price-to-earnings (P/E) ratio of 32.02 and a price-to-book (P/B) ratio of 5.37, both signaling a premium market valuation that may expose investors to downside risk if growth expectations are unmet. The absence of dividend yield (0%) could deter income-focused investors. While the company’s leverage metrics are favorable, the moderate Piotroski score points to potential limitations in financial robustness. These factors, combined with a net margin stagnation reflected in a slight 5.34% decline over the past year, suggest caution amid current elevated market pricing.
Our Verdict about Fabrinet
Fabrinet’s long-term fundamental profile appears favorable, supported by value creation and strong financial health. Coupled with a bullish overall stock trend and slightly buyer-dominant recent trading behavior (55.75% buyer dominance), the company might appear attractive for investors seeking growth exposure. However, premium valuation multiples and moderate financial score caution that despite long-term strength, a measured approach could be warranted to identify an optimal entry point.
Disclaimer: This content is for informational purposes only and does not constitute financial, investment, or other professional advice. Investing in financial markets involves a significant risk of loss, and past performance is not indicative of future results.
Additional Resources
- Is Fabrinet’s (FN) Nvidia Partnership Quietly Redefining Its Role in the Data Center Stack? – simplywall.st (Jan 24, 2026)
- Here’s What Barclays Has to Say About Fabrinet (FN) – Yahoo Finance (Jan 23, 2026)
- Baillie Gifford & Co. Has $201.69 Million Stock Position in Fabrinet $FN – MarketBeat (Jan 24, 2026)
- AI Leader Fabrinet Eyes New Buy Point Despite Stock Market Sell-Off – Investor’s Business Daily (Jan 20, 2026)
- Here’s What Barclays Has to Say About Fabrinet (FN) – Insider Monkey (Jan 23, 2026)
For more information about Fabrinet, please visit the official website: fabrinet.com