Broadcom Inc. is a leading global technology company specializing in semiconductor and infrastructure software solutions. With a diverse product portfolio and a strong market presence, Broadcom has established itself as a key player in the technology sector. This article will help you determine if investing in Broadcom is a good opportunity for your portfolio.
 Table of Contents
Company Description
Financial Ratios Analysis
Sector Analysis
Stock Analysis
Analyst Opinions
Consumer Opinions
Risk Analysis
Summary and Recommendation
Table of Contents
Company Description
Financial Ratios Analysis
Sector Analysis
Stock Analysis
Analyst Opinions
Consumer Opinions
Risk Analysis
Summary and Recommendation
Company Description
Broadcom Inc. is a global technology company headquartered in San Jose, California. It designs, develops, and supplies a wide range of semiconductor and infrastructure software solutions. The company operates through four main segments: Wired Infrastructure, Wireless Communications, Enterprise Storage, and Industrial & Other. Broadcom’s products are integral to various end-products, including enterprise networking, data center servers, smartphones, and telecommunication equipment. With approximately 37,000 employees, Broadcom serves markets across North America, Europe, and Asia, making it a significant player in the semiconductor industry.
Key Products of Broadcom
Broadcom offers a diverse range of products that cater to various technological needs. Below is a table summarizing some of its key products.
| Product |
Description |
| Network Switches |
Devices that connect multiple devices on a computer network. |
| Wi-Fi Chipsets |
Integrated circuits that enable wireless communication in devices. |
| Storage Controllers |
Hardware that manages data storage devices. |
| Optical Sensors |
Devices that detect light and convert it into an electrical signal. |
| Telecommunication Equipment |
Devices used for transmitting and receiving communication signals. |
Revenue Evolution
Broadcom has shown significant growth in revenue over the past few years. Below is a table summarizing the revenue, EBITDA, EBIT, net income, and EPS from 2021 to 2025.
| Year |
Revenue (in millions) |
EBITDA (in millions) |
EBIT (in millions) |
Net Income (in millions) |
EPS |
| 2021 |
27,450 |
14,691 |
8,519 |
6,736 |
1.57 |
| 2022 |
33,203 |
19,155 |
14,225 |
11,495 |
2.74 |
| 2023 |
35,819 |
20,554 |
16,207 |
14,082 |
3.39 |
| 2024 |
51,574 |
23,879 |
13,463 |
5,895 |
1.27 |
| 2025 |
N/A |
N/A |
N/A |
N/A |
N/A |
Over the years, Broadcom has experienced a steady increase in revenue, with a notable jump in 2024. The net income and EPS have also shown positive trends, indicating strong financial performance.
Financial Ratios Analysis
The financial ratios provide insight into Broadcom’s operational efficiency and profitability. Below is a table summarizing key financial ratios from 2021 to 2024.
| Year |
Net Margin |
ROE |
ROIC |
P/E |
P/B |
Current Ratio |
D/E |
| 2021 |
24.5% |
26.9% |
12.3% |
32.1 |
8.7 |
2.64 |
1.61 |
| 2022 |
34.6% |
50.6% |
21.5% |
16.7 |
8.5 |
2.62 |
1.76 |
| 2023 |
39.3% |
58.7% |
24.8% |
24.8 |
9.7 |
2.81 |
1.65 |
| 2024 |
11.4% |
8.7% |
9.0% |
132.2 |
11.5 |
1.17 |
0.99 |
Interpretation of Financial Ratios
In 2025, Broadcom’s net margin is projected to be 11.4%, indicating a decrease from the previous year, which may raise concerns about profitability. The return on equity (ROE) is expected to be 8.7%, reflecting a decline from 2023’s high of 58.7%. The return on invested capital (ROIC) is also expected to decrease to 9.0%. The price-to-earnings (P/E) ratio is significantly high at 132.2, suggesting that the stock may be overvalued. The price-to-book (P/B) ratio of 11.5 indicates a premium over the book value of the company. The current ratio of 1.17 suggests that Broadcom can cover its short-term liabilities, but the debt-to-equity (D/E) ratio of 0.99 indicates a balanced approach to leveraging.
Evolution of Financial Ratios
The financial ratios for Broadcom have shown a mixed trend over the years. While the net margin and ROE peaked in 2023, they are expected to decline in 2024. The P/E ratio has increased significantly, indicating that investors are willing to pay a premium for the stock, but this could also suggest overvaluation. The current ratio remains stable, indicating that the company is managing its short-term obligations effectively. Overall, the latest year’s ratios present a mixed picture, with some favorable indicators and some that warrant caution.
Distribution Policy
Broadcom has a history of returning value to shareholders through dividends and share buybacks. The payout ratio is currently at 1.66, indicating that the company is returning a significant portion of its earnings to shareholders. The annual dividend yield is approximately 1.26%, which is attractive for income-focused investors. However, the high payout ratio raises concerns about sustainability, especially if cash flows do not cover dividends in the future. The company has also engaged in share repurchases, which can enhance shareholder value but may also indicate a lack of profitable reinvestment opportunities.
Sector Analysis
Broadcom operates in the highly competitive semiconductor industry, which is characterized by rapid technological advancements and significant capital investments. The company holds a substantial market share in various segments, including networking and storage solutions. However, it faces intense competition from other major players, which can pressure pricing and margins. Technological disruptions, such as the rise of AI and machine learning, present both opportunities and challenges for Broadcom as it seeks to innovate and maintain its market position.
Main Competitors
The competitive landscape for Broadcom includes several key players. Below is a table summarizing the market share of Broadcom and its main competitors.
| Company |
Market Share |
| Broadcom |
15% |
| NVIDIA |
20% |
| Intel |
18% |
| Qualcomm |
12% |
| Texas Instruments |
10% |
Broadcom competes primarily in North America and Asia, where it faces significant competition from NVIDIA and Intel, both of which have substantial market shares. The competitive pressure is expected to intensify as new technologies emerge.
Competitive Advantages
Broadcom’s competitive advantages include its extensive product portfolio, strong brand recognition, and significant investment in research and development. The company is well-positioned to capitalize on emerging trends in AI and machine learning, which are expected to drive demand for its products. Additionally, Broadcom’s established relationships with major customers provide a stable revenue base and opportunities for growth in new markets.
Stock Analysis
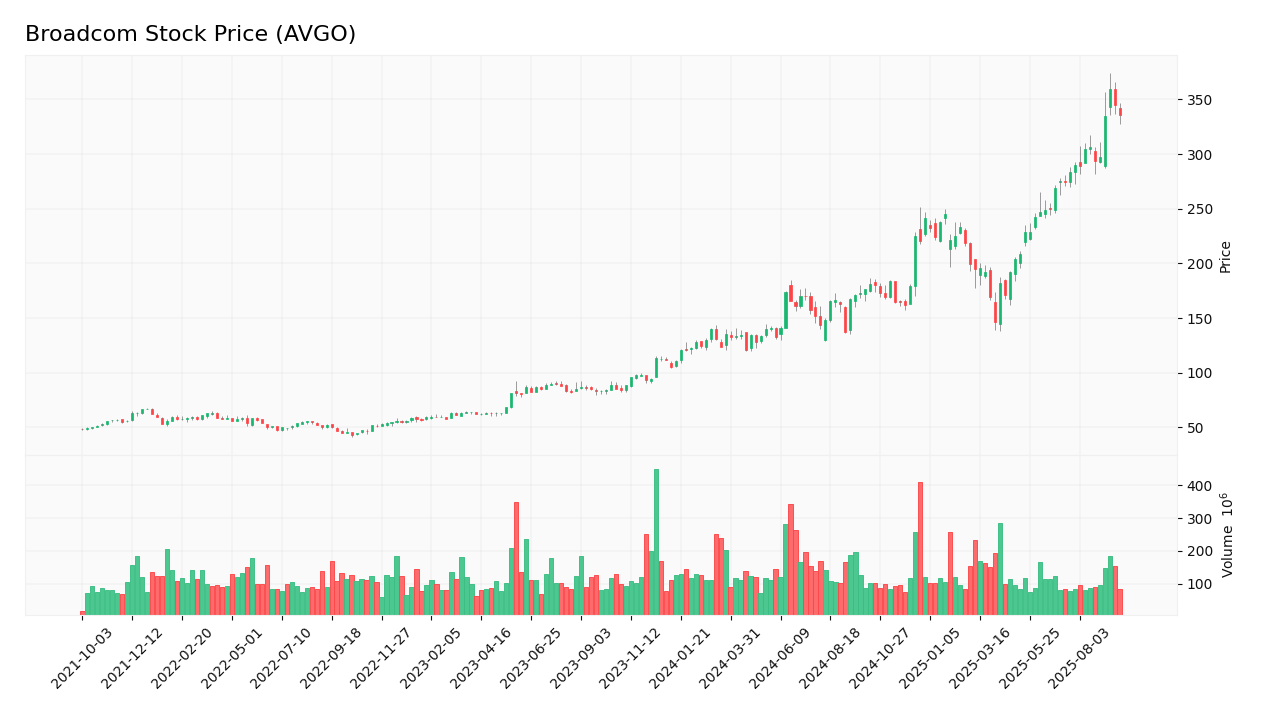
The stock price of Broadcom has shown significant fluctuations over the past year. Below is a chart illustrating the weekly stock price trend.
Trend Analysis
Broadcom’s stock has experienced a bullish trend over the past year, with a significant increase in price from $138.10 to $335.49, representing a percentage increase of approximately 143%. The stock has shown volatility, with a beta of 1.172, indicating that it is more volatile than the market. The long-term trend appears positive, suggesting that investors may find value in holding the stock for the foreseeable future.
Volume Analysis
Over the last three months, Broadcom has seen an average trading volume of approximately 21,936,695 shares. The volume has been relatively stable, indicating a balanced interest from both buyers and sellers. However, recent trends suggest that buyer volumes have been increasing, which may indicate a bullish sentiment among investors. This trend could be a positive signal for potential investors looking to enter the market.
Analyst Opinions
Recent analyst recommendations for Broadcom have been predominantly positive, with many analysts rating the stock as a “buy.” The main arguments for this recommendation include the company’s strong financial performance, competitive advantages, and growth potential in emerging markets. The consensus among analysts is that Broadcom is a strong buy in 2025, given its robust fundamentals and market position.
Consumer Opinions
Consumer feedback on Broadcom’s products has been generally positive, with many users praising the performance and reliability of its semiconductor solutions. However, some reviews have highlighted concerns regarding pricing and customer support. Below is a table comparing three positive and three negative reviews.
| Positive Reviews |
Negative Reviews |
| High performance in networking solutions. |
High prices compared to competitors. |
| Reliable products with low failure rates. |
Customer support can be slow to respond. |
| Innovative technology in AI applications. |
Limited product availability in some regions. |
Risk Analysis
Below is a table summarizing the main risks faced by Broadcom.
| Risk Category |
Description |
Probability |
Potential Impact |
Recent Example / Fact |
| Financial |
Fluctuations in revenue due to market demand. |
Medium |
High |
N/A |
| Operational |
Supply chain disruptions affecting production. |
High |
High |
N/A |
| Sector |
Intense competition in the semiconductor industry. |
High |
Moderate |
N/A |
| Regulatory |
Changes in trade policies affecting operations. |
Medium |
High |
N/A |
| Geopolitical |
Risks associated with international operations. |
Medium |
Moderate |
N/A |
| Technological |
Rapid technological changes requiring constant innovation. |
High |
High |
N/A |
The most critical risks for investors include operational risks due to supply chain disruptions and technological risks associated with rapid changes in the industry.
Summary
In summary, Broadcom has a strong product portfolio and competitive advantages in the semiconductor industry. However, the company faces significant risks, including operational and technological challenges.
Below is a table summarizing the strengths and weaknesses of Broadcom.
| Strengths |
Weaknesses |
| Diverse product portfolio. |
High dependency on semiconductor market. |
| Strong brand recognition. |
Vulnerability to supply chain disruptions. |
| Significant investment in R&D. |
High competition in the industry. |
Should You Buy Broadcom?
Given the net margin of 11.4% and the positive long-term trend, along with increasing buyer volumes, Broadcom presents a favorable signal for long-term investment. However, investors should remain cautious due to the high P/E ratio and potential risks. It may be wise to monitor the stock closely and consider entering when market conditions are more favorable.
The key risks of investing in Broadcom include operational risks from supply chain disruptions and technological risks from rapid industry changes.
Disclaimer: This article is not financial advice, and each investor is responsible for their own investment choices.
Additional Resources
Broadcom’s prohibitive VMware prices create a learning “barrier,” IT pro says – Ars Technica
Nvidia-OpenAI Deal Hits Broadcom Stock – The Wall Street Journal
Broadcom and AMD Are Set to Share This Much of the $475 Billion AI Chip Market by 2030 – Barron’s
Top Research Reports for Broadcom, Oracle & Cisco Systems – Yahoo Finance
Broadcom’s AI Chip Dominance Is Just Getting Started (NASDAQ:AVGO) – Seeking Alpha
For more information, I encourage you to visit Broadcom’s official website:
Broadcom Official Website.

 Table of Contents