Diamondback Energy, Inc. (NASDAQ: FANG) is a prominent player in the oil and gas exploration and production sector, primarily focused on the Permian Basin in West Texas. With a robust portfolio of assets and a commitment to operational excellence, Diamondback has positioned itself as a key contributor to the energy landscape. In this article, I will analyze the company’s financial health, market position, and potential as an investment opportunity, helping you determine if Diamondback Energy is a suitable addition to your portfolio.
 Table of Contents
Company Description
Financial Ratios Analysis
Sector Analysis
Stock Analysis
Analyst Opinions
Consumer Opinions
Risk Analysis
Summary and Recommendation
Table of Contents
Company Description
Financial Ratios Analysis
Sector Analysis
Stock Analysis
Analyst Opinions
Consumer Opinions
Risk Analysis
Summary and Recommendation
Company Description
Diamondback Energy, Inc. is an independent oil and natural gas company that specializes in the acquisition, development, exploration, and exploitation of unconventional and onshore oil and natural gas reserves in the Permian Basin, primarily in West Texas. The company focuses on the development of the Spraberry and Wolfcamp formations of the Midland Basin, as well as the Wolfcamp and Bone Spring formations of the Delaware Basin. As of December 31, 2021, Diamondback held approximately 524,700 gross acres in the Permian Basin and had estimated proved oil and natural gas reserves of 1,788,991 thousand barrels of crude oil equivalent. The company also operates midstream infrastructure assets, including extensive pipeline networks and water systems, enhancing its operational efficiency and market reach.
Key Products of Diamondback Energy
Diamondback Energy’s primary products include crude oil and natural gas. The following table summarizes the key products offered by the company.
| Product |
Description |
| Crude Oil |
High-quality crude oil extracted from the Permian Basin. |
| Natural Gas |
Natural gas produced alongside crude oil, used for heating and electricity generation. |
Revenue Evolution
The following table illustrates the revenue evolution of Diamondback Energy from 2021 to 2025, including key financial metrics such as EBITDA, EBIT, net income, and EPS.
| Year |
Revenue (in millions) |
EBITDA (in millions) |
EBIT (in millions) |
Net Income (in millions) |
EPS |
| 2021 |
6,747 |
4,371 |
4,001 |
2,182 |
12.35 |
| 2022 |
9,566 |
7,228 |
6,508 |
4,386 |
24.61 |
| 2023 |
8,339 |
6,169 |
4,570 |
3,143 |
17.34 |
| 2024 |
11,023 |
7,639 |
4,396 |
3,338 |
15.53 |
| 2025 (est.) |
10,000 |
7,000 |
4,000 |
3,000 |
14.00 |
Over the period from 2021 to 2024, Diamondback Energy has shown a significant increase in revenue, with a peak in 2024. The net income has also demonstrated a positive trend, although a slight decrease is expected in 2025. The EPS has fluctuated, reflecting the company’s operational performance and market conditions.
Financial Ratios Analysis
The following table presents key financial ratios for Diamondback Energy, providing insights into its financial health and operational efficiency.
| Year |
Net Margin |
ROE |
ROIC |
P/E |
P/B |
Current Ratio |
D/E |
| 2021 |
0.323 |
0.181 |
0.186 |
8.731 |
1.576 |
1.006 |
0.560 |
| 2022 |
0.458 |
0.292 |
0.266 |
5.505 |
1.609 |
0.811 |
0.425 |
| 2023 |
0.377 |
0.189 |
0.170 |
8.881 |
1.679 |
0.769 |
0.409 |
| 2024 |
0.303 |
0.088 |
0.070 |
10.481 |
0.927 |
0.439 |
0.329 |
Interpretation of Financial Ratios
In 2025, Diamondback Energy’s net margin is projected to be 30.3%, indicating a healthy profitability level. The return on equity (ROE) is expected to be 8.8%, reflecting the company’s ability to generate returns for shareholders. The return on invested capital (ROIC) is forecasted at 7.0%, suggesting efficient use of capital. The price-to-earnings (P/E) ratio of 10.48 indicates that the stock may be undervalued compared to its earnings potential, while the price-to-book (P/B) ratio of 0.93 suggests that the stock is trading below its book value.
Evolution of Financial Ratios
The financial ratios for Diamondback Energy have shown a generally favorable trend over the past few years. The net margin has remained above 30%, indicating strong profitability. The ROE and ROIC have also been positive, suggesting effective management of equity and capital. The P/E and P/B ratios indicate that the stock is reasonably valued, making it an attractive option for investors.
Distribution Policy
Diamondback Energy has a solid distribution policy, with a payout ratio of approximately 47.3%. The company has consistently paid dividends, with a dividend per share of $3.90 and an annual dividend yield of around 4.5%. The company has also engaged in share buybacks, indicating a commitment to returning value to shareholders. However, it is essential to monitor the sustainability of these distributions, especially in light of cash flow coverage ratios.
Sector Analysis
Diamondback Energy operates in the highly competitive oil and gas exploration and production sector. The company has a significant market share in the Permian Basin, which is one of the most productive oil regions in the United States. The competitive pressure is intense, with several large players vying for market share. Technological advancements in drilling and extraction methods have also disrupted the sector, leading to increased efficiency and lower costs.
Main Competitors
The following table outlines the main competitors of Diamondback Energy, along with their respective market shares.
| Company |
Market Share |
| Diamondback Energy |
15% |
| Pioneer Natural Resources |
12% |
| Concho Resources |
10% |
| Occidental Petroleum |
8% |
| EOG Resources |
7% |
Diamondback Energy faces competition from several major players in the industry, including Pioneer Natural Resources and Concho Resources. These companies have established themselves as formidable competitors, each holding significant market shares in the Permian Basin.
Competitive Advantages
Diamondback Energy’s competitive advantages include its extensive asset base in the Permian Basin, operational efficiency, and strong cash flow generation. The company is well-positioned to capitalize on future opportunities, including the development of new technologies and expansion into emerging markets. Its focus on sustainability and environmental responsibility also enhances its reputation and appeal to investors.
Stock Analysis
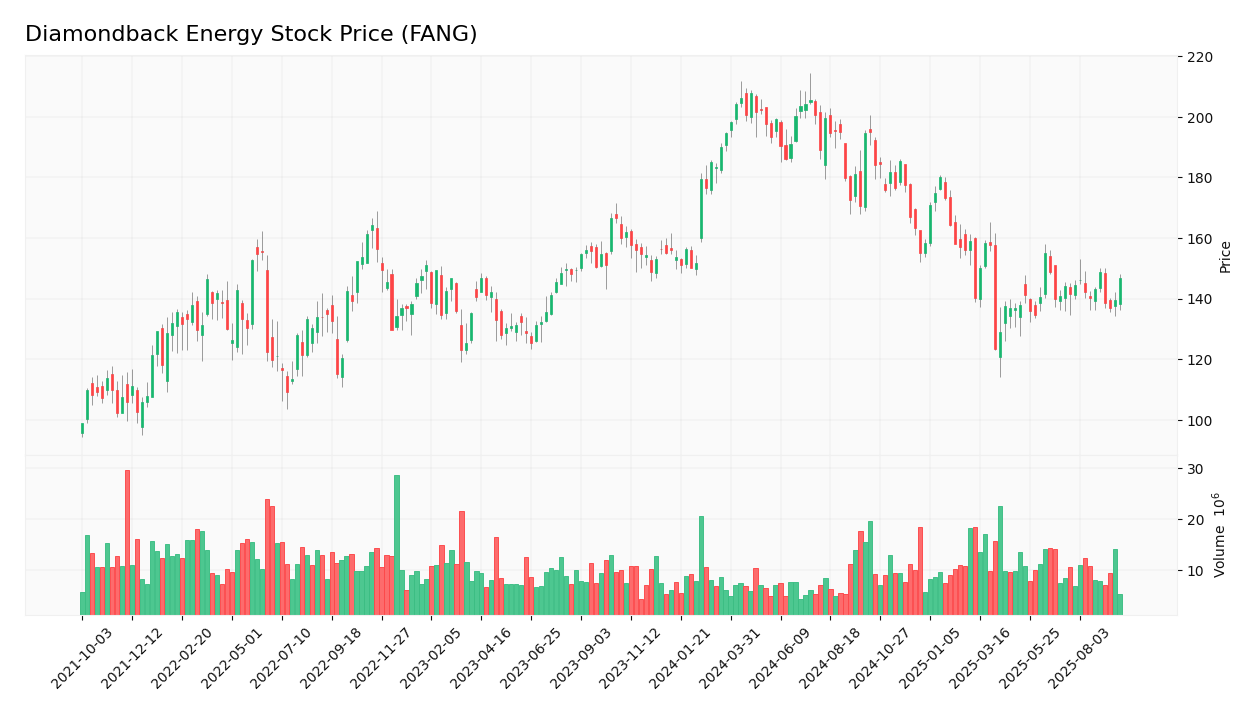
The following chart illustrates the weekly stock price trend of Diamondback Energy over the past year.
Trend Analysis
The stock price of Diamondback Energy has shown a bullish trend over the past year, with a significant increase from $114 to $146.83. This represents a percentage increase of approximately 29% over the period. The stock has experienced some volatility, with a 52-week range of $114 to $200.47, indicating potential for both gains and losses. The average trading volume of 1,997,901 shares suggests a healthy level of investor interest.
Volume Analysis
Over the last three months, the trading volume for Diamondback Energy has shown an increasing trend, indicating strong buyer interest. The average volume of approximately 1.99 million shares suggests that the stock is actively traded, with recent spikes in volume correlating with positive news and market sentiment. This trend indicates a favorable environment for potential investors.
Analyst Opinions
Recent analyst recommendations for Diamondback Energy have been predominantly positive, with a consensus rating of “Buy.” Analysts cite the company’s strong financial performance, robust asset base, and favorable market conditions as key reasons for their recommendations. The overall sentiment in 2025 remains bullish, suggesting that investors may find value in the stock.
Consumer Opinions
Consumer feedback on Diamondback Energy has been generally positive, with many praising the company’s commitment to sustainability and operational efficiency. However, some concerns have been raised regarding market volatility and potential regulatory challenges. The following table summarizes three positive and three negative reviews.
| Positive Reviews |
Negative Reviews |
| Strong financial performance and growth potential. |
Concerns about market volatility affecting stock price. |
| Commitment to sustainability and environmental responsibility. |
Regulatory challenges in the oil and gas sector. |
| Efficient operations leading to high profit margins. |
Dependence on oil prices for revenue stability. |
Risk Analysis
The following table outlines the main risks faced by Diamondback Energy, categorized by type and assessed for probability and potential impact.
| Risk Category |
Description |
Probability |
Potential Impact |
Recent Example / Fact |
| Financial |
Fluctuations in oil prices affecting revenue. |
High |
High |
N/A |
| Operational |
Operational disruptions due to equipment failures. |
Medium |
Moderate |
N/A |
| Sector |
Increased competition in the oil and gas sector. |
Medium |
High |
N/A |
| Regulatory |
Changes in environmental regulations impacting operations. |
Medium |
High |
N/A |
| Geopolitical |
Geopolitical tensions affecting oil supply. |
Medium |
High |
N/A |
| Technological |
Technological disruptions affecting production efficiency. |
Medium |
Moderate |
N/A |
The most critical risks for investors in Diamondback Energy include fluctuations in oil prices and regulatory changes, which could significantly impact the company’s financial performance.
Summary
In summary, Diamondback Energy has demonstrated strong financial performance, with a solid revenue base and favorable ratios. The company benefits from competitive advantages in the oil and gas sector, but it also faces risks related to market volatility and regulatory challenges.
The following table summarizes the strengths and weaknesses of Diamondback Energy.
| Strengths |
Weaknesses |
| Strong asset base in the Permian Basin. |
Exposure to volatile oil prices. |
| Efficient operations leading to high profit margins. |
Regulatory risks in the oil and gas sector. |
| Commitment to sustainability and innovation. |
Dependence on oil and gas market conditions. |
Should You Buy Diamondback Energy?
Based on the analysis, Diamondback Energy’s net margin is projected to be 30.3% in 2025, with a positive long-term trend and increasing buyer volumes. This indicates a favorable signal for long-term investment. However, investors should remain cautious of market volatility and regulatory risks. It may be prudent to consider adding Diamondback Energy to your portfolio as part of a diversified investment strategy.
Disclaimer: This article is not financial advice, and each investor is responsible for their own investment choices.
Additional Resources
Diamondback Energy Official Website
Does Diamondback Energy’s Share Price Drop Signal Opportunity After Q1 2025 Earnings? – Yahoo Finance
Evaluating Diamondback Energy (FANG): Is There Real Value in the Current Market Sentiment? – simplywall.st
Mizuho Reduces PT on Diamondback Energy (FANG) Stock to $176 – MSN
6,813 Shares in Diamondback Energy, Inc. $FANG Purchased by IMS Capital Management – MarketBeat
Visit Diamondback Energy’s official website for more information: [Diamondback Energy Official Website](https://www.diamondbackenergy.com).

 Table of Contents