Nike, Inc. is a global leader in athletic footwear, apparel, and equipment, renowned for its innovative designs and marketing strategies. With a strong brand presence and a diverse product range, Nike continues to capture the hearts of consumers worldwide. This article will help you determine if investing in Nike is a good opportunity based on its financial performance, market position, and future outlook.
 Table of Contents
Company Description
Nike, Inc. is a leading global company that designs, develops, markets, and sells athletic footwear, apparel, equipment, and accessories. Founded in 1964 and headquartered in Beaverton, Oregon, Nike operates in the Consumer Cyclical sector, specifically within the Apparel – Footwear & Accessories industry. The company has a strong presence in North America, Europe, Asia, and other international markets, catering to men, women, and children. Nike’s innovative products and marketing strategies have established it as a dominant player in the athletic wear market, appealing to both casual consumers and professional athletes alike.
Key Products of NIKE
Nike offers a wide range of products, including athletic and casual footwear, apparel, and accessories. Below is a table summarizing some of its key products.
| Product |
Description |
| Air Max |
Iconic line of athletic shoes known for their visible air cushioning. |
| Jordan Brand |
Premium basketball shoes and apparel associated with Michael Jordan. |
| Converse |
Casual sneakers and apparel under the Converse brand. |
| NIKE Pro |
Performance apparel designed for athletes and fitness enthusiasts. |
| NIKE Training |
Footwear and apparel designed for various training activities. |
Revenue Evolution
Nike has shown a consistent growth trajectory in its revenue over the past few years. Below is a table summarizing the revenue, EBITDA, EBIT, net income, and EPS from 2021 to 2025.
| Year |
Revenue (in millions) |
EBITDA (in millions) |
EBIT (in millions) |
Net Income (in millions) |
EPS |
| 2021 |
44,493 |
7,694 |
7,132 |
5,727 |
3.64 |
| 2022 |
46,792 |
7,660 |
6,779 |
6,046 |
3.83 |
| 2023 |
51,191 |
7,187 |
5,313 |
5,070 |
3.27 |
| 2024 |
51,386 |
7,757 |
6,043 |
5,700 |
3.76 |
| 2025 |
46,309 |
3,885 |
3,702 |
3,219 |
2.17 |
Nike’s revenue peaked in 2023, with a slight decline in 2025. However, the net income and EPS have also shown fluctuations, indicating a need for careful monitoring of the company’s financial health.
Financial Ratios Analysis
The financial ratios provide insight into Nike’s operational efficiency and profitability. Below is a table summarizing key financial ratios from 2021 to 2025.
| Year |
Net Margin |
ROE |
ROIC |
P/E |
P/B |
Current Ratio |
D/E |
| 2021 |
12.87% |
44.86% |
25.41% |
36.95 |
16.57 |
2.72 |
1.00 |
| 2022 |
12.91% |
39.57% |
22.91% |
31.04 |
12.28 |
2.63 |
0.83 |
| 2023 |
9.94% |
36.20% |
18.79% |
32.21 |
11.66 |
2.72 |
0.87 |
| 2024 |
11.09% |
39.50% |
21.96% |
25.31 |
9.99 |
2.40 |
0.83 |
| 2025 |
6.92% |
24.36% |
14.23% |
27.95 |
6.81 |
2.21 |
0.83 |
Interpretation of Financial Ratios
In 2025, Nike’s net margin of 6.92% indicates a decline in profitability compared to previous years. The return on equity (ROE) of 24.36% suggests that the company is still generating a good return for its shareholders, although it has decreased from prior years. The return on invested capital (ROIC) of 14.23% reflects the efficiency of capital use, which is also lower than in previous years. The price-to-earnings (P/E) ratio of 27.95 indicates that investors are willing to pay a premium for Nike’s earnings, while the price-to-book (P/B) ratio of 6.81 suggests that the stock is valued significantly higher than its book value. The current ratio of 2.21 indicates good short-term liquidity, while the debt-to-equity (D/E) ratio of 0.83 shows a balanced approach to leveraging.
Evolution of Financial Ratios
The financial ratios for Nike have shown a mixed trend over the past few years. While the net margin and ROIC have decreased, the current ratio remains strong, indicating good liquidity. The P/E and P/B ratios suggest that the stock is still perceived positively by investors, despite the decline in profitability. Overall, the latest year’s ratios indicate a need for caution, as profitability metrics have weakened.
Distribution Policy
Nike has a payout ratio of 71.45%, indicating a significant portion of earnings is returned to shareholders through dividends. The annual dividend yield of 2.56% is attractive for income-focused investors. However, the company has also engaged in share buybacks, which can enhance shareholder value but may raise concerns if dividends are not fully covered by cash flow. The recent trend of increasing dividends alongside share repurchases suggests a commitment to returning value to shareholders, but investors should monitor cash flow to ensure sustainability.
Sector Analysis
Nike operates in the highly competitive apparel and footwear industry, where it holds a significant market share. The company faces competition from brands like Adidas, Puma, and Under Armour, which exert pressure on pricing and innovation. Technological advancements in materials and manufacturing processes are crucial for maintaining a competitive edge. Nike’s strong brand loyalty and marketing strategies help mitigate competitive pressures, but ongoing innovation is essential to stay ahead.
Main Competitors
The following table summarizes Nike’s main competitors and their market shares.
| Company |
Market Share |
| Nike |
27% |
| Adidas |
20% |
| Puma |
10% |
| Under Armour |
5% |
| Others |
38% |
Nike’s market share of 27% positions it as a leader in the athletic footwear and apparel market. Adidas follows closely with 20%, while Puma and Under Armour hold smaller shares. The competitive landscape remains dynamic, with various brands vying for consumer attention.
Competitive Advantages
Nike’s competitive advantages include its strong brand recognition, innovative product offerings, and extensive distribution network. The company invests heavily in research and development to create cutting-edge products that appeal to consumers. Additionally, Nike’s marketing strategies, including partnerships with high-profile athletes and influencers, enhance its brand image. Looking ahead, Nike has opportunities to expand into emerging markets and develop sustainable products, which could further strengthen its market position.
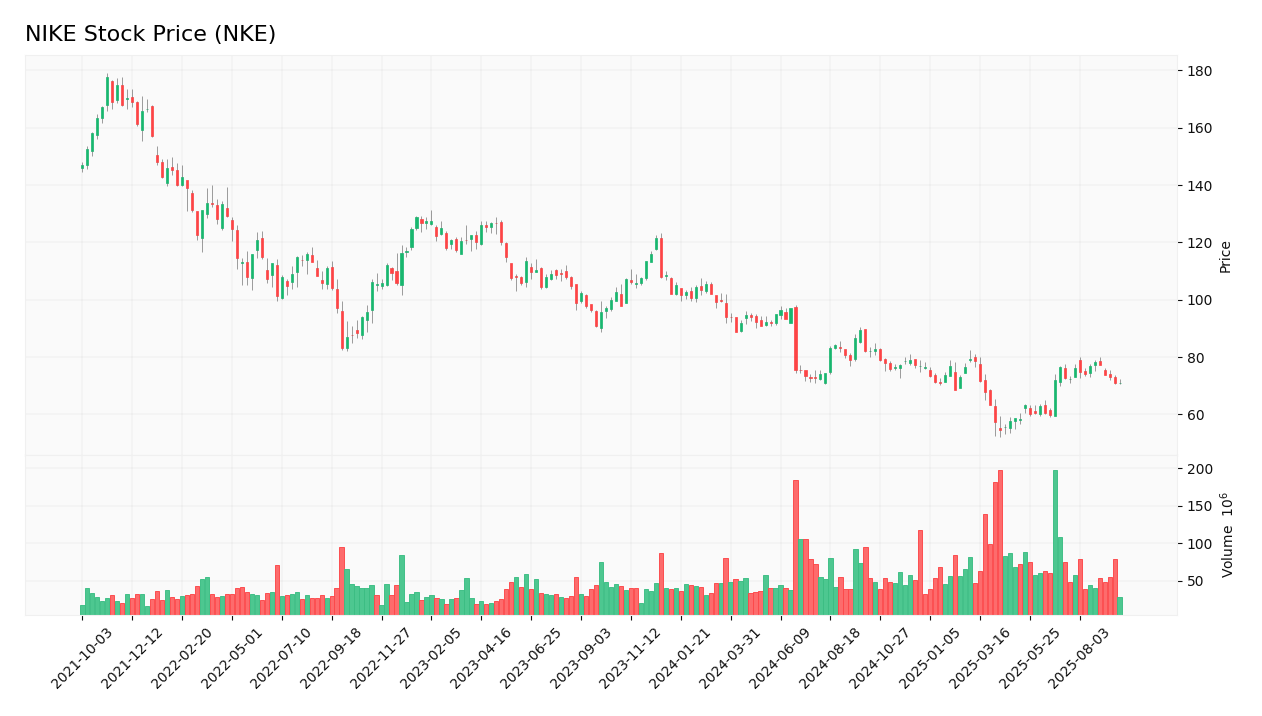
Stock Analysis
The stock price of Nike has shown significant fluctuations over the past year. Below is a chart illustrating the weekly stock price trend.
Trend Analysis
Nike’s stock price has experienced a bearish trend over the past year, with a significant decline from its peak of $126.92 in May 2023 to $71.23 in September 2025. This represents a decrease of approximately 43.9%. The stock has shown volatility, with a beta of 1.244, indicating that it is more volatile than the market. The recent price range of $52.28 to $90.62 suggests that the stock is currently trading near its lower end, which may present a buying opportunity for long-term investors.
Volume Analysis
Over the last three months, Nike’s average trading volume has been approximately 14,576,682 shares. The volume has shown an increasing trend, indicating a growing interest from investors. This increase in volume suggests that the stock is currently more buyer-driven, which could be a positive signal for potential investors.
Analyst Opinions
Recent analyst recommendations for Nike have been mixed, with some analysts suggesting a “buy” rating due to the company’s strong brand and market position, while others recommend a “hold” due to concerns over declining profitability. The consensus among analysts in 2025 leans towards a “hold” rating, indicating caution as the company navigates its current challenges.
Consumer Opinions
Consumer feedback on Nike products is generally positive, with many praising the quality and performance of their footwear and apparel. However, some consumers have expressed concerns about pricing and availability. Below is a comparison of three positive and three negative reviews.
| Positive Reviews |
Negative Reviews |
| High-quality materials and durability. |
Prices are higher compared to competitors. |
| Innovative designs and technology. |
Limited availability of popular sizes. |
| Comfortable and stylish for everyday wear. |
Customer service issues reported. |
Risk Analysis
The following table outlines the main risks faced by Nike.
| Risk Category |
Description |
Probability |
Potential Impact |
Recent Example / Fact |
| Financial |
Declining profitability due to increased competition. |
Medium |
High |
N/A |
| Operational |
Supply chain disruptions affecting product availability. |
High |
Moderate |
COVID-19 impact on logistics. |
| Sector |
Intense competition from other athletic brands. |
High |
High |
N/A |
| Regulatory |
Changes in trade policies affecting international sales. |
Medium |
Moderate |
N/A |
| Geopolitical |
Political instability in key markets. |
Medium |
High |
N/A |
| Technological |
Failure to innovate and keep up with market trends. |
Medium |
High |
N/A |
The most critical risks for investors include financial and operational risks, particularly related to declining profitability and supply chain disruptions.
Summary
In summary, Nike remains a strong player in the athletic wear market, with flagship products that continue to resonate with consumers. However, the company faces challenges in profitability and competition.
The following table summarizes Nike’s strengths and weaknesses.
| Strengths |
Weaknesses |
| Strong brand recognition and loyalty. |
High pricing compared to competitors. |
| Innovative product offerings. |
Supply chain vulnerabilities. |
| Diverse global market presence. |
Fluctuating profitability metrics. |
Should You Buy NIKE?
Based on the net margin of 6.92% for 2025, the long-term trend being bearish, and the current buyer volume, it is advisable to wait for a bullish reversal before considering an investment in Nike. The key risks of investing in Nike include declining profitability and supply chain disruptions, which should be closely monitored.
Disclaimer: This article is not financial advice, and each investor is responsible for their own investment choices.
Additional Resources

 Table of Contents