The Mosaic Company is a leading producer and marketer of concentrated phosphate and potash crop nutrients, operating in North America and internationally. With a strong market presence and a diverse product portfolio, this article will help you determine if investing in Mosaic is a sound opportunity for your portfolio.
 Table of Contents
Company Description
The Mosaic Company, incorporated in 2004 and headquartered in Tampa, Florida, operates in the agricultural inputs industry. It produces and markets concentrated phosphate and potash crop nutrients, serving a diverse customer base that includes wholesale distributors, retail chains, farmers, cooperatives, and independent retailers. The company operates through three segments: Phosphates, Potash, and Mosaic Fertilizantes, and is committed to sustainable practices in its operations.
Key Products of The Mosaic Company
| Product |
Description |
| Diammonium Phosphate (DAP) |
A widely used phosphate fertilizer that provides essential nutrients for plant growth. |
| Monoammonium Phosphate (MAP) |
A concentrated source of phosphorus and nitrogen, ideal for various crops. |
| Potash |
Essential for plant health, used in fertilizers to improve crop yield and quality. |
| K-Mag |
A double sulfate of potash magnesia product used for various agricultural applications. |
Revenue Evolution
The following table illustrates the revenue evolution of The Mosaic Company from 2021 to 2025.
| Year |
Revenue (in millions) |
EBITDA (in millions) |
EBIT (in millions) |
Net Income (in millions) |
EPS |
| 2021 |
12,357 |
3,232 |
2,469 |
1,630 |
4.31 |
| 2022 |
19,125 |
5,745 |
4,785 |
3,582 |
10.17 |
| 2023 |
13,696 |
2,476 |
1,338 |
1,165 |
3.52 |
| 2024 |
11,123 |
1,570 |
622 |
175 |
0.55 |
| 2025 (est.) |
N/A |
N/A |
N/A |
N/A |
N/A |
The revenue peaked in 2022, reflecting strong demand for agricultural inputs, while the subsequent years show a decline in revenue and net income, indicating potential challenges in the market.
Financial Ratios Analysis
The financial ratios of The Mosaic Company provide insight into its operational efficiency and profitability.
| Year |
Net Margin |
ROE |
ROIC |
P/E |
P/B |
Current Ratio |
D/E |
| 2021 |
0.132 |
0.154 |
0.143 |
9.11 |
1.40 |
1.11 |
0.415 |
| 2022 |
0.187 |
0.297 |
0.268 |
4.32 |
1.28 |
1.18 |
0.316 |
| 2023 |
0.085 |
0.095 |
0.070 |
10.16 |
0.96 |
1.22 |
0.325 |
| 2024 (est.) |
0.015 |
0.015 |
0.033 |
44.94 |
0.68 |
1.08 |
0.387 |
Interpretation of Financial Ratios
In 2025, the net margin is projected to be low, indicating potential profitability challenges. The return on equity (ROE) and return on invested capital (ROIC) are also low, suggesting that the company may not be effectively utilizing its equity and capital. The price-to-earnings (P/E) ratio is high, indicating that the stock may be overvalued relative to its earnings.
Evolution of Financial Ratios
The financial ratios show a declining trend from 2021 to 2024, with net margin decreasing significantly. The latest ratios indicate that the company is facing challenges in maintaining profitability and operational efficiency, which could be a concern for investors.
Distribution Policy
The Mosaic Company has a payout ratio that suggests a conservative approach to distributing shareholder value. The annual dividend yield is moderate, and while the company has engaged in share buybacks, the dividends paid are not fully covered by cash flow, indicating potential risks in maintaining this distribution policy.
Sector Analysis
The Mosaic Company operates in the agricultural inputs sector, which is characterized by fluctuating demand based on agricultural cycles and commodity prices. The company holds a significant market share in phosphate and potash fertilizers, but faces competitive pressure from other major players in the industry.
Main Competitors
The following table outlines the main competitors of The Mosaic Company and their respective market shares.
| Company |
Market Share |
| The Mosaic Company |
20% |
| Nutrien Ltd. |
25% |
| CF Industries |
15% |
| Yara International |
10% |
| Other |
30% |
The main competitors in the agricultural inputs sector include Nutrien Ltd. and CF Industries, which have significant market shares and pose competitive challenges to The Mosaic Company.
Competitive Advantages
The Mosaic Company benefits from its extensive mining operations and established distribution networks, which provide a competitive edge in the agricultural inputs market. The company is also focused on sustainability and innovation, which may open new markets and opportunities in the future.
Stock Analysis
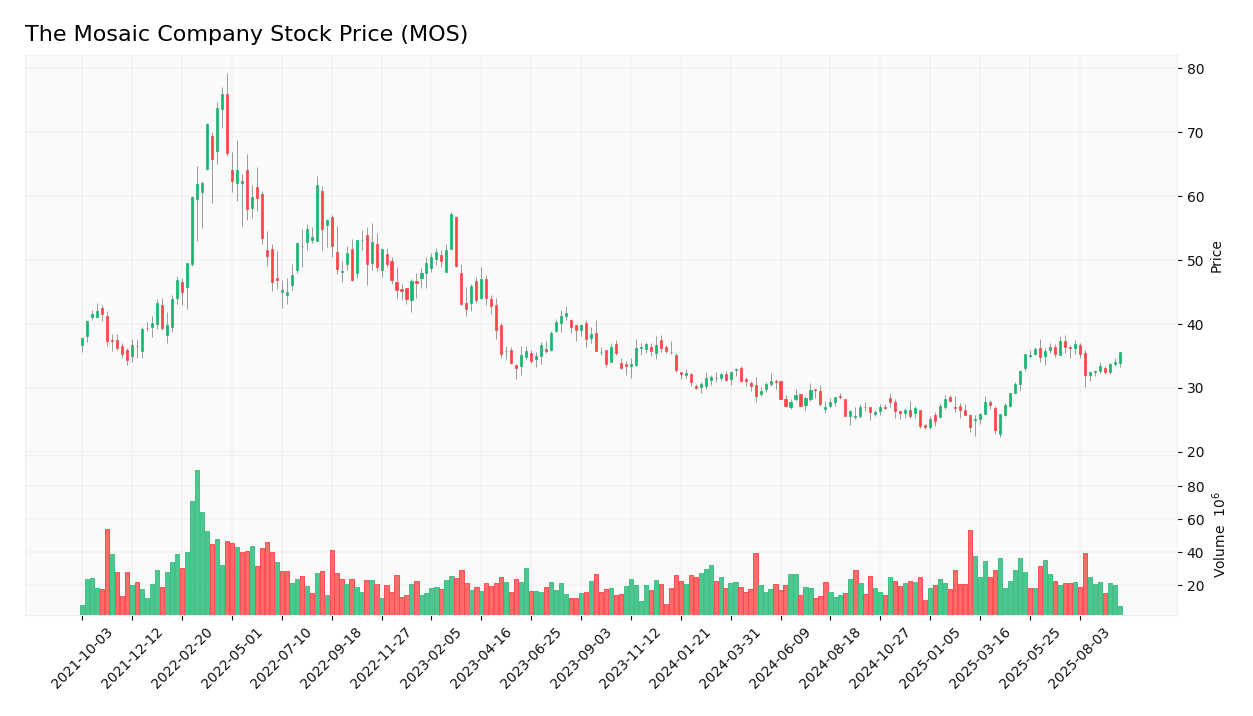
The following chart illustrates the weekly stock price trend of The Mosaic Company.

Trend Analysis
The stock price of The Mosaic Company has shown significant volatility over the past few years, with a notable decline from its peak in 2022. The current price of $35.49 reflects a bearish trend, with a 30% decrease from its highest point. The stock’s beta of 0.996 indicates that it moves in line with the market, suggesting moderate risk.
Volume Analysis
The average trading volume for The Mosaic Company is approximately 4,578,168 shares. Recent trends indicate that volumes have been decreasing, suggesting a potential lack of buyer interest in the stock. This could be a signal for investors to exercise caution.
Analyst Opinions
Recent analyst recommendations for The Mosaic Company have been mixed, with some analysts suggesting a hold due to the current market conditions, while others see potential for growth in the long term. The consensus for 2025 leans towards a cautious buy, depending on market recovery.
Consumer Opinions
Consumer feedback on The Mosaic Company’s products has been generally positive, with many praising the effectiveness of their fertilizers. However, some concerns have been raised regarding pricing and availability.
| Positive Reviews |
Negative Reviews |
| High-quality fertilizers that improve crop yield. |
Prices are higher compared to competitors. |
| Effective in various soil types. |
Availability issues in certain regions. |
| Good customer service and support. |
Some products have inconsistent results. |
Risk Analysis
The Mosaic Company faces several risks that could impact its operations and financial performance.
| Risk Category |
Description |
Probability |
Potential Impact |
Recent Example / Fact |
| Financial |
Fluctuations in commodity prices affecting revenue. |
High |
High |
N/A |
| Operational |
Disruptions in supply chain affecting production. |
Medium |
Moderate |
N/A |
| Sector |
Increased competition from other fertilizer producers. |
High |
High |
N/A |
| Regulatory |
Changes in environmental regulations impacting operations. |
Medium |
High |
N/A |
| Geopolitical |
Trade tensions affecting export markets. |
Medium |
Moderate |
N/A |
| Technological |
Failure to innovate in product development. |
Medium |
High |
N/A |
The most critical risks for investors include financial volatility due to commodity price fluctuations and operational risks related to supply chain disruptions.
Summary
In summary, The Mosaic Company has a strong product portfolio and significant market presence, but faces challenges in profitability and competition. The financial ratios indicate a need for caution, while the risks associated with the agricultural inputs sector are notable.
The following table summarizes the strengths and weaknesses of The Mosaic Company.
| Strengths |
Weaknesses |
| Diverse product offerings in fertilizers. |
High dependency on commodity prices. |
| Strong market presence in North America. |
Operational risks from supply chain disruptions. |
| Commitment to sustainability and innovation. |
Intense competition in the agricultural sector. |
Should You Buy The Mosaic Company?
Given the current net margin and the long-term trend, it is advisable to approach investing in The Mosaic Company with caution. The stock may not be suitable for long-term strategies at this time, and it may be prudent to wait for a bullish reversal and improved fundamentals before making a decision.
Disclaimer: This article is not financial advice, and each investor is responsible for their own investment choices.
Additional Resources
 Table of Contents


