
Benefit from the bull and bear markets with one pattern
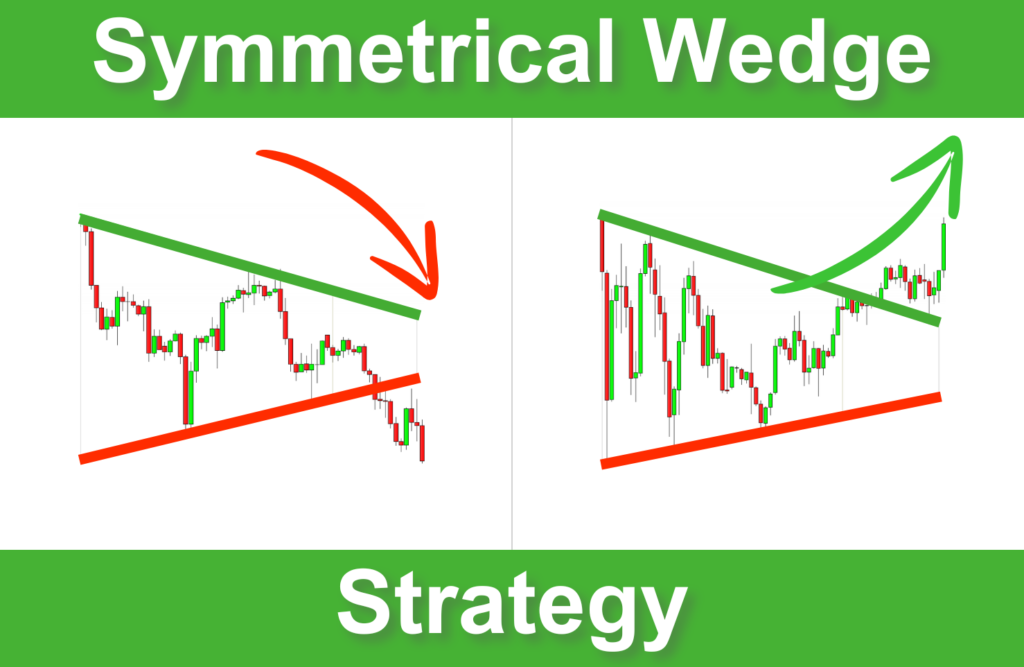
The symmetrical wedge is one of the most powerful patterns I know. It occurs when the price moves between two converging trendlines, shaping a wedge. A breakout of one of its trendlines indicates the beginning of a new trend.
In this post, I will show you how to use symmetrical wedges to benefit from all types of markets in any direction.

- I. What is a Symmetrical Wedge Pattern?
- II. How to Identify a Symmetrical Wedge?
- III. Understanding the Symmetrical Wedge Breakouts
- IV. The two symmetrical wedge strategies
- V. How to Trade the Symmetrical Wedge Breakouts?
- VI. Tips for Success with the Symmetrical Wedge Strategy
- VII. Symmetrical Wedge Summary
I. What is a Symmetrical Wedge Pattern?
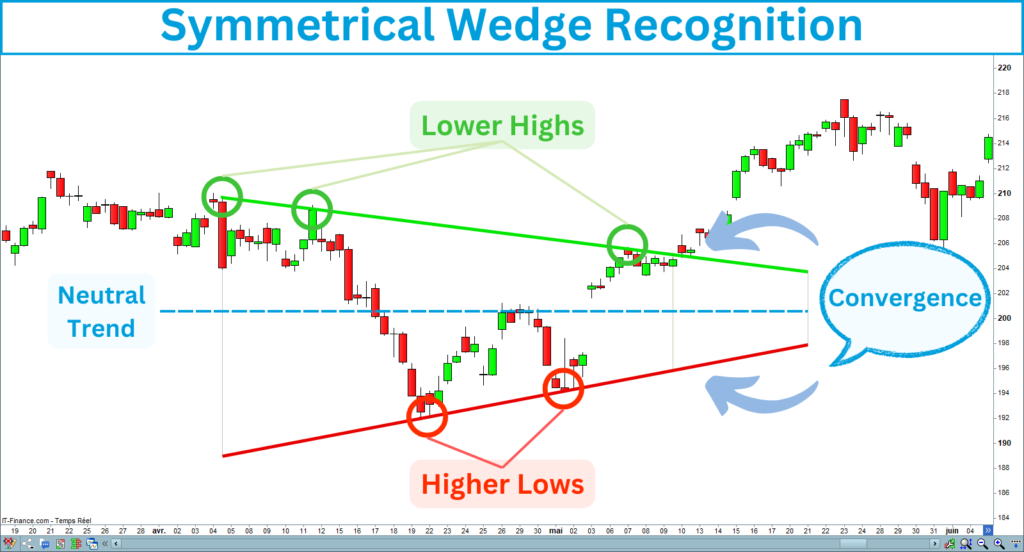
A symmetrical wedge pattern forms when the price of an asset is moving in a contracting range represented by two trendlines. One slopes downward, connecting the lower highs, and the other slopes upward, connecting the higher lows. This creates a wedge shape that becomes narrower over time as the price consolidates.
This pattern reflects a balance between buyers and sellers, with neither side gaining control, leading to reduced volatility. As the price approaches the wedge’s apex, a breakout is inevitable, and its direction will determine the future trend.
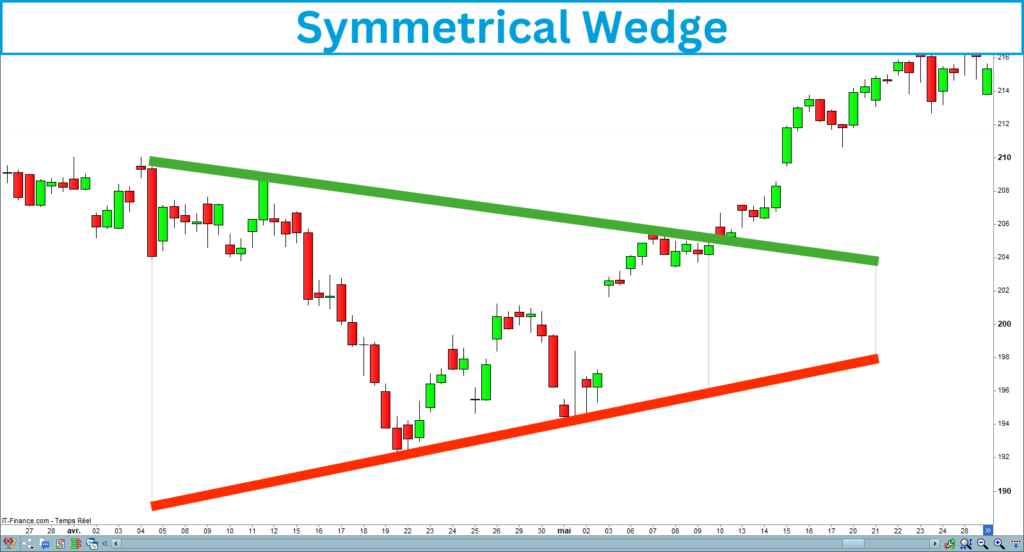
Here is a screenshot of a symmetrical wedge that occurred on the Nasdaq in the 4-hour timeframe:

II. How to Identify a Symmetrical Wedge?
Key Features of the Symmetrical Wedge
Before diving into the strategy, correctly identifying a symmetrical wedge on the chart is indispensable. Here are the key characteristics of this pattern, which must be satisfied:
The following chart shows a symmetrical wedge meeting the previous criteria:
III. Understanding the Symmetrical Wedge Breakouts
One key aspect of the symmetrical wedge pattern is the breakout. It refers to the point at which the price moves beyond one of the trendlines (upper or lower), signaling a potential new trend direction.
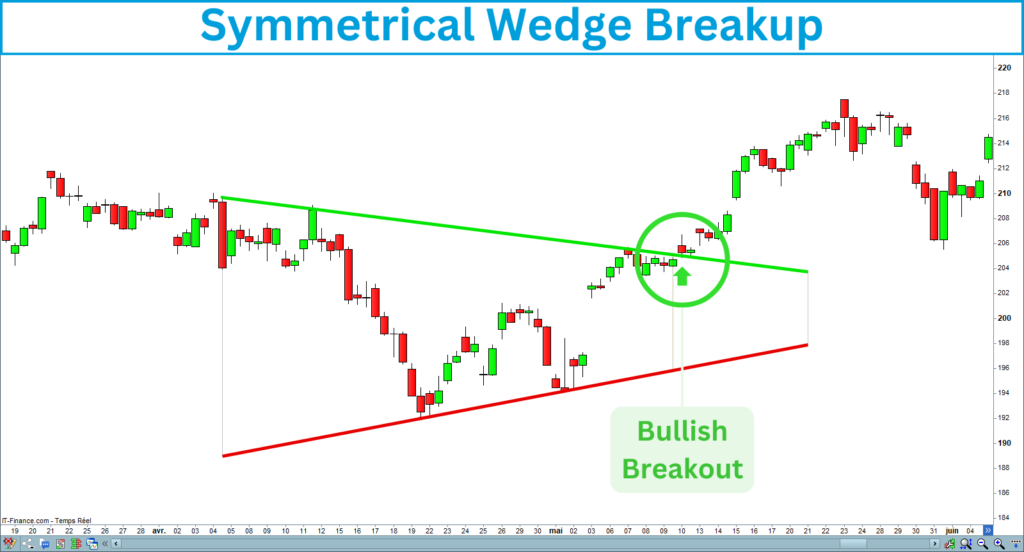
A. Bullish Breakout
A bullish breakout occurs when the price breaks above the upper trendline of the wedge. This suggests that buyers have gained control, and the price may initiate a new bullish trend.
Here is an example of a symmetrical wedge bullish breakout:
B. Bearish Breakout
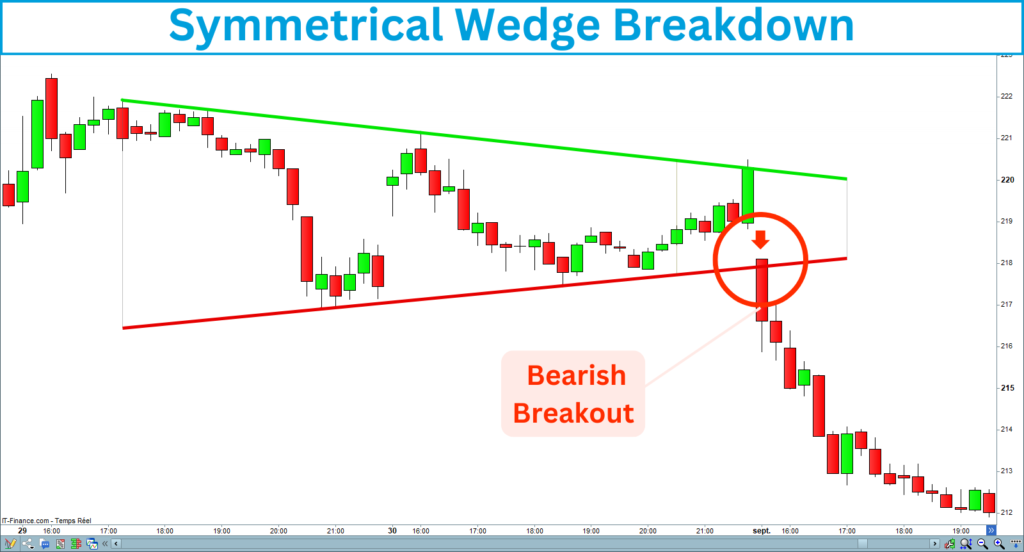
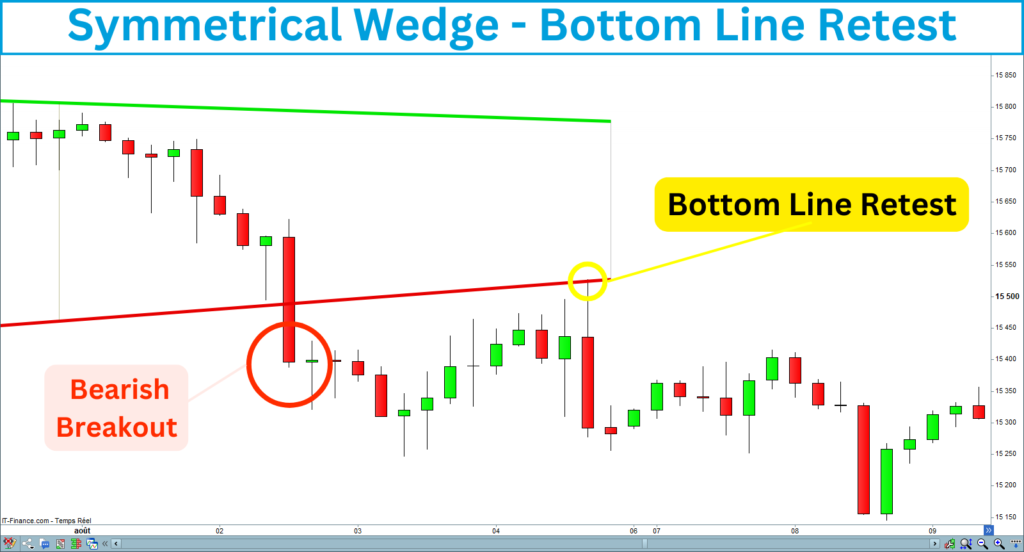
A bearish breakout occurs when the price breaks below the lower trendline of the wedge. This suggests that sellers have taken control, and the price would start a new bearish trend.
Here is an example of a symmetrical wedge bearish breakout:
IV. The two symmetrical wedge strategies
The symmetrical wedge is neutral, so you can exploit its bullish and bearish breakouts to buy and sell the market. Since this pattern can occur after a bull and bear market, you can bet on the trend continuation or trend reversal.
Here are the two trading strategies you can operate using symmetrical wedges:
A. Trend continuation
The trend continuation refers to the idea that the market trend will persist in the same direction after a temporary pause or consolidation. When the price breaks a key level, you can enter a trade to benefit from the future continuation movement. The symmetrical wedges will help you detect these key-level breakouts.
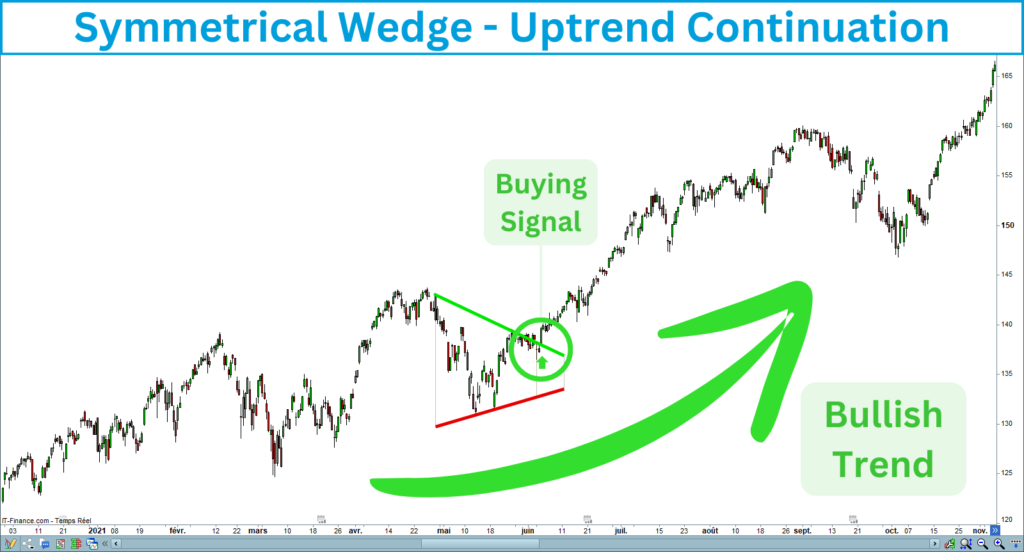
Uptrend continuation
The uptrend continuation signal occurs after the price breaks up the upper line of the symmetrical wedge, which presupposes the uptrend restarting. This signal is only valid within a long-term bull trend.
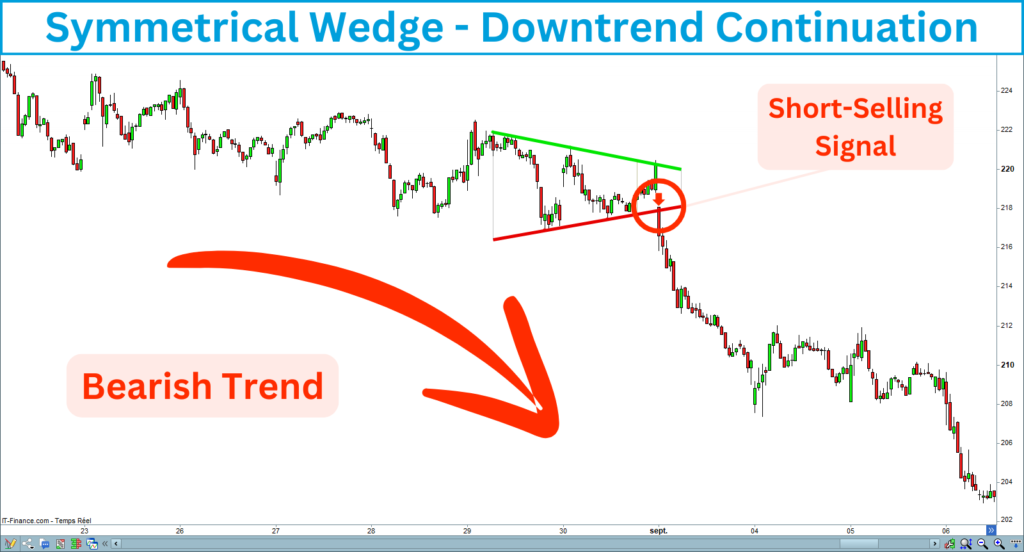
Downtrend continuation
The downtrend continuation signal occurs after the price breaks down the down line of the symmetrical wedge, which presupposes the downtrend restarting. This signal is only valid within a long-term bear trend.
B. Trend reversal
A trend reversal occurs when the direction of the market trend changes. This means that the previously trending market begins to move in the opposite direction.
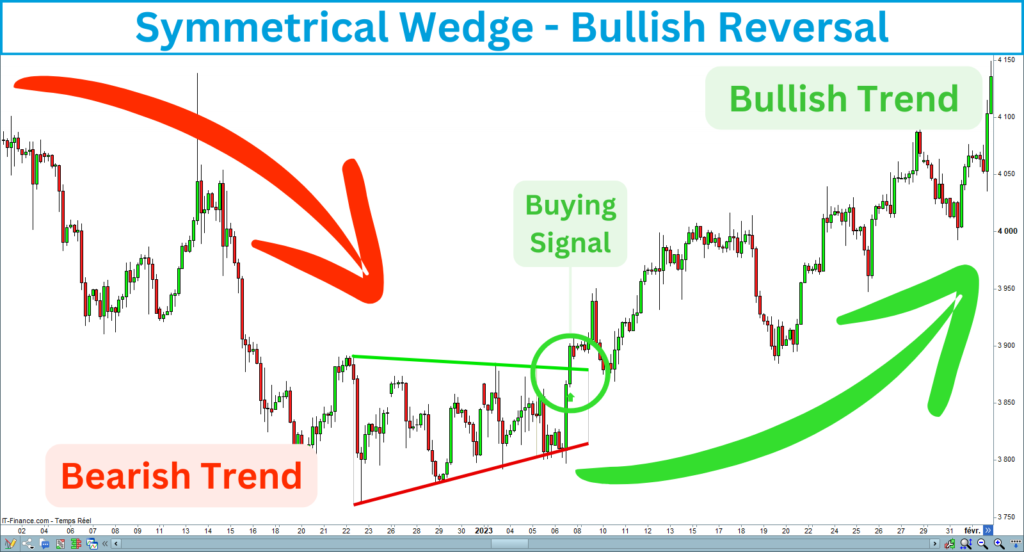
Bullish reversal
A bullish reversal refers to a change in the market’s direction from a downtrend to an uptrend. The bullish reversal signal occurs after the price breaks up the upper line of the symmetrical wedge in a long-term bearish trend.
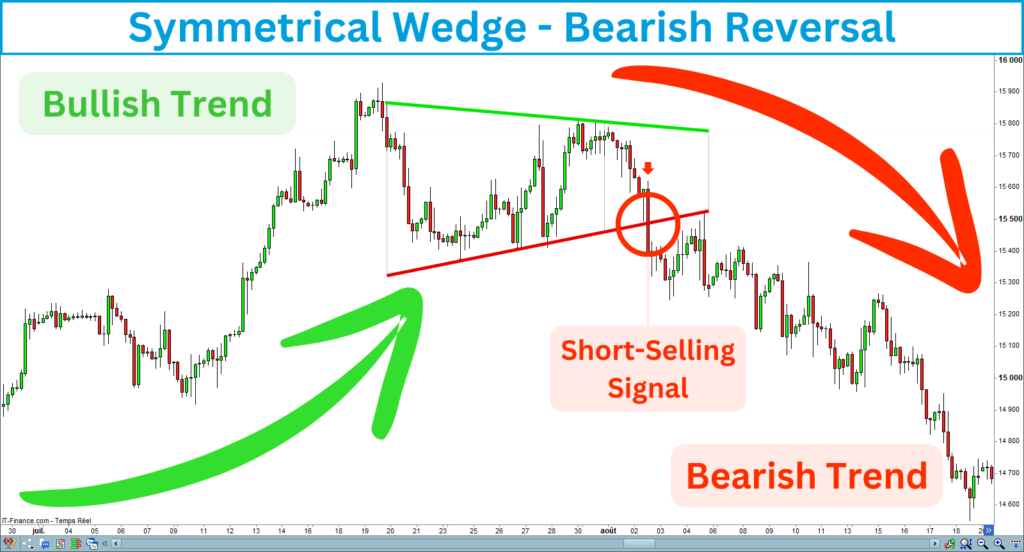
Bearish reversal
A bearish reversal refers to a change in the market’s direction from an uptrend to a downtrend. The bearish reversal signal occurs after the price breaks down the down line of the symmetrical wedge in a long-term bullish trend.
V. How to Trade the Symmetrical Wedge Breakouts?
The symmetrical wedge breakout strategy revolves around waiting for the breakout and capitalizing on the ensuing trend. I will show you how to trade this pattern effectively:
1. Identify the Symmetrical Wedge Pattern
First, spot the symmetrical wedge by drawing two trendlines: one connecting the lower highs and the other connecting the higher lows. Ensure that the lines converge and the price-tightening ranges form a wedge horizontally.
2. Wait for the Breakout
Patience is key with the symmetrical wedge pattern. Wait for the price to break above or below the trendlines before making your trade. It’s crucial not to jump into the trade before the breakout.
3. Confirm the Breakout
Sometimes, the price briefly moves beyond the trendline and then reverses. So, it is essential to look for confirmation before entering the trade. A breakout is validated when the candle following the breakout closes in the same direction.
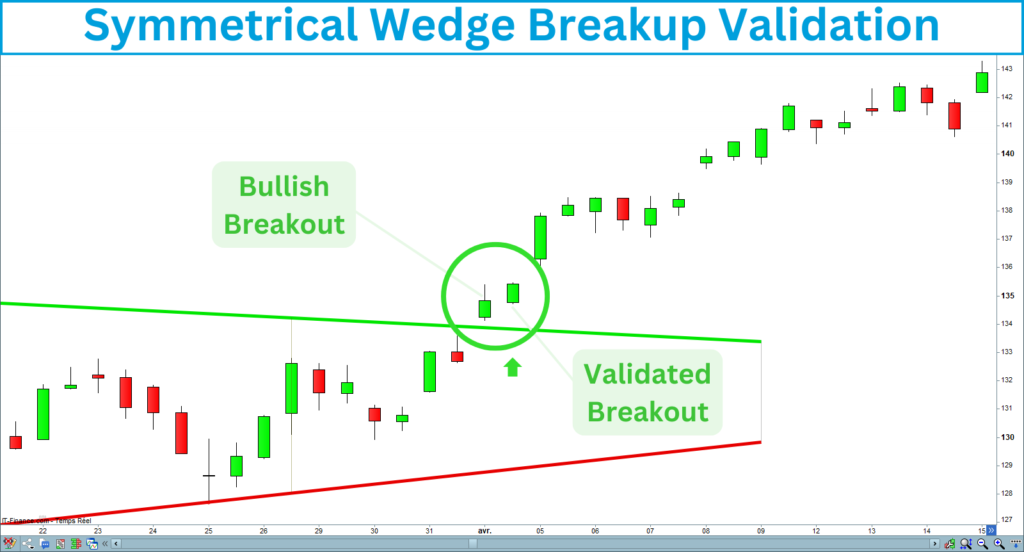
Breakup validation
A breakup is validated if the next candle closes above the line:
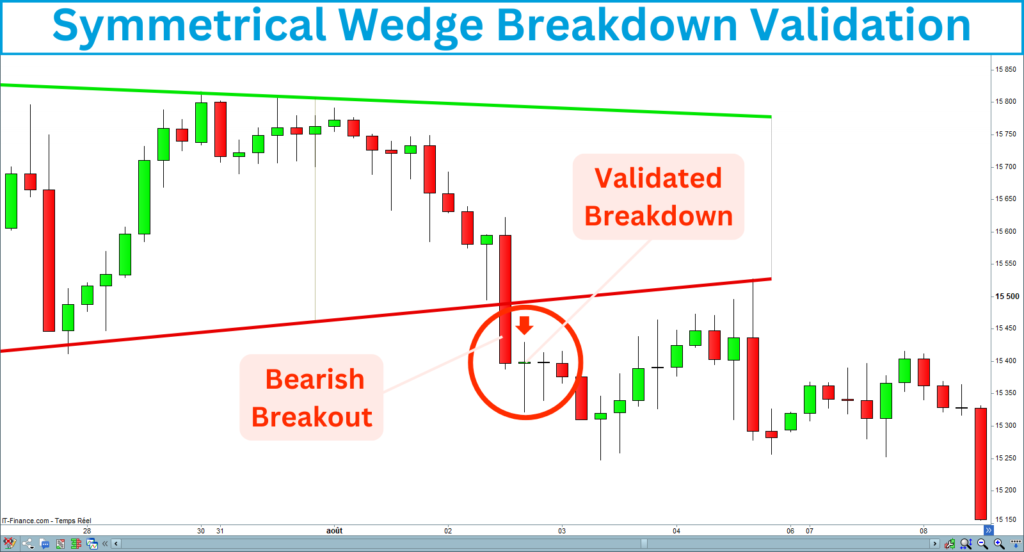
Breakdown validation
A breakdown is validated if the candle closes under the line:
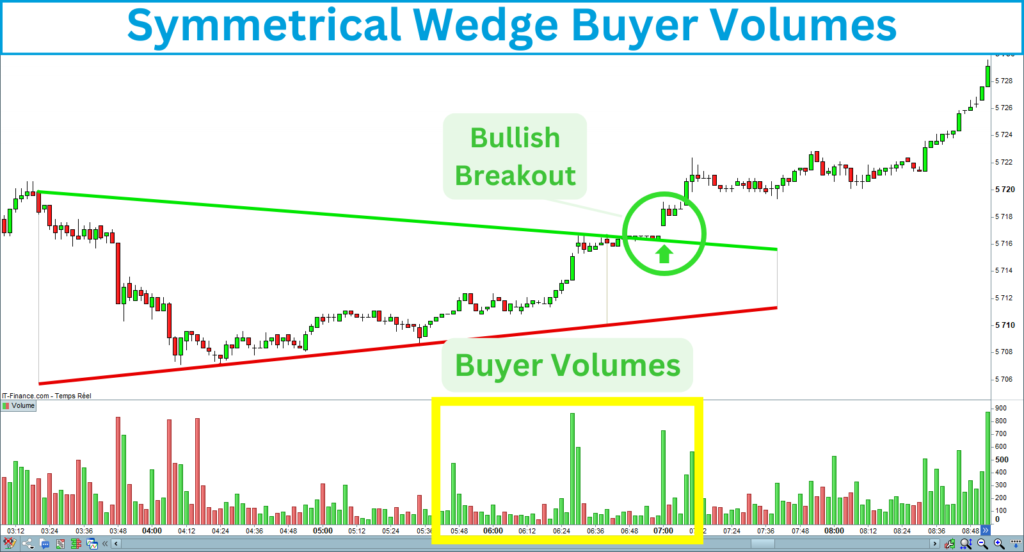
4. Validate the volume
Breakouts with higher-than-average volume are more likely to sustain the move. That means many traders agreed with the new direction. Checking the increasing volumes is one of the best ways to avoid false breakouts.
Buyer volumes
You should see buyer volumes before and during the bullish breakout of the symmetrical wedge top line:
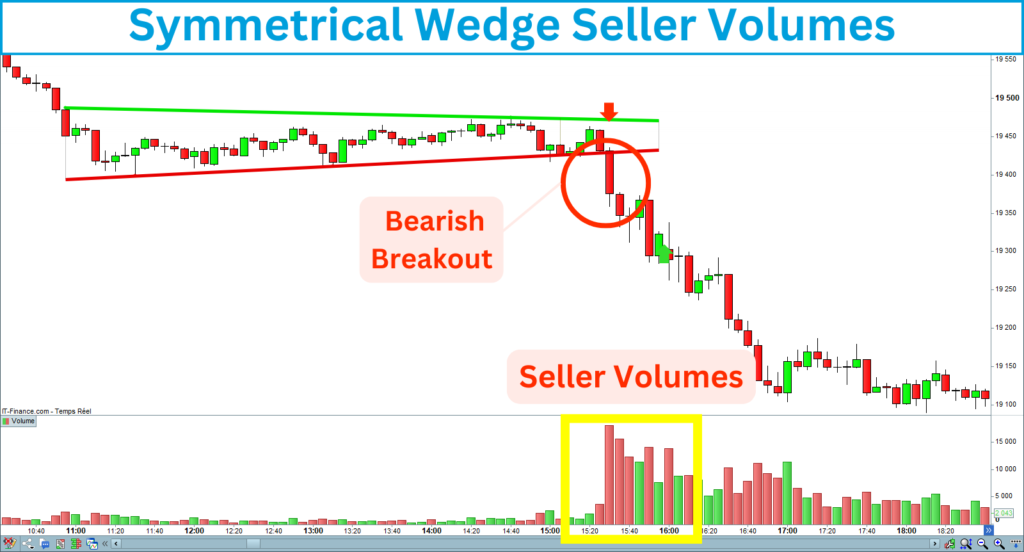
Seller volumes
You should see seller volumes before and during the bearish breakout of the symmetrical wedge bottom line:
5. Check the market strength
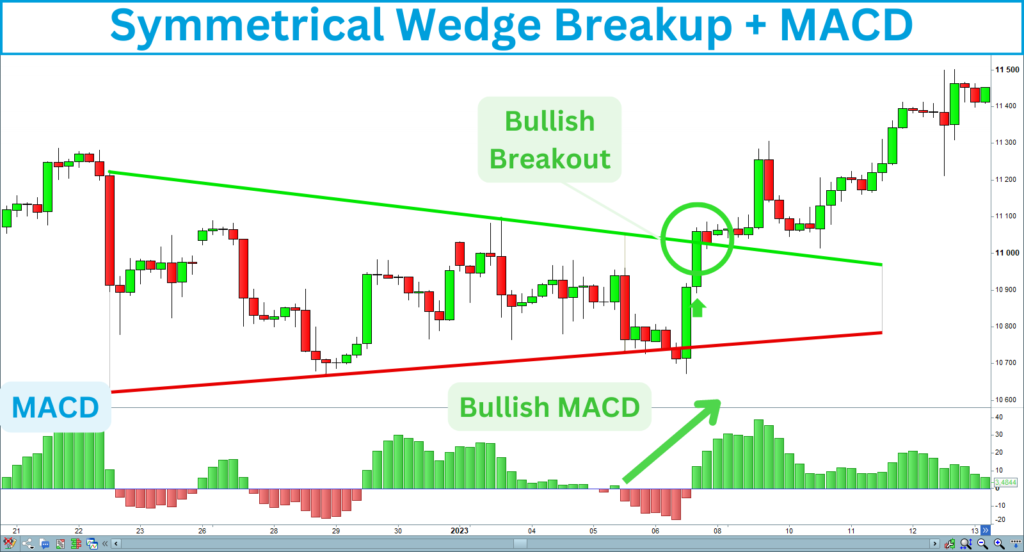
You can use strength indicators to check the market’s strength. Verify that the strength increases before opening a long entry and decreases before opening a short entry. Several indicators, including RSI, MACD, and Stochastic, enable the measurement of strength.
Market Strengthening
The following chart shows a strengthening in the market, confirming a long signal:
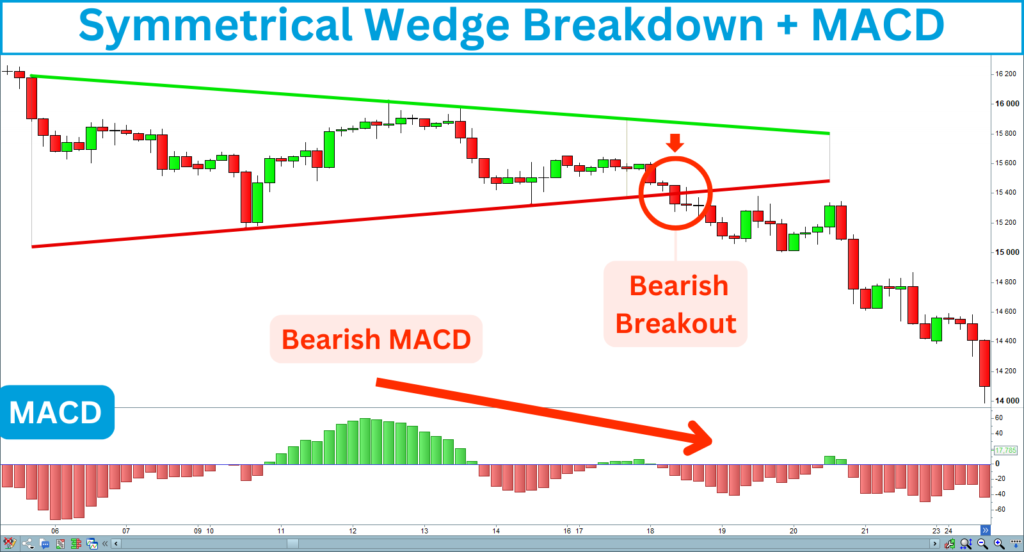
Market Weakening
The following chart shows a weakening in the market, confirming a short signal:
6. Enter the Trade
Once the breakout is confirmed, enter the trade toward the breakout.
Entry opening
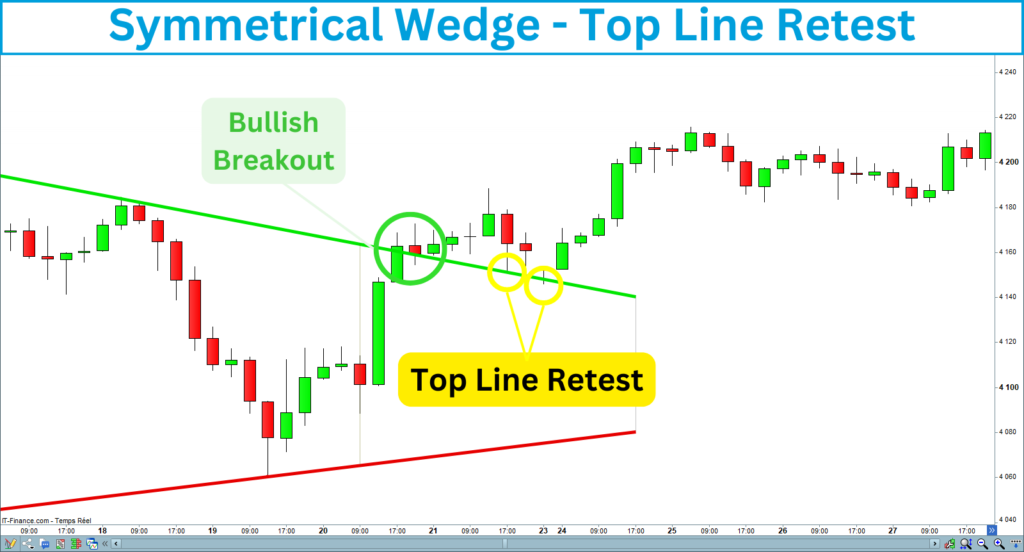
Retest
Sometimes, the price retraces and retests the level after the breakout. The signal is confirmed if the level holds and the price moves back toward the breakout. The retest does not happen every time, but it allows you to reinforce your position or enter the trade if you have missed the breakout signal.
7. Set the Stop-Loss
The market will not always give you the right. Setting a stop-loss is vital to protect your capital. You must place a stop-loss just outside the opposite side of the wedge to manage risk. Many traders think they should set their stop-loss beside the opposite wedge line, but I discovered a better way.
Here’s how you can determine the best position for your stop-loss based on the direction of your trade:
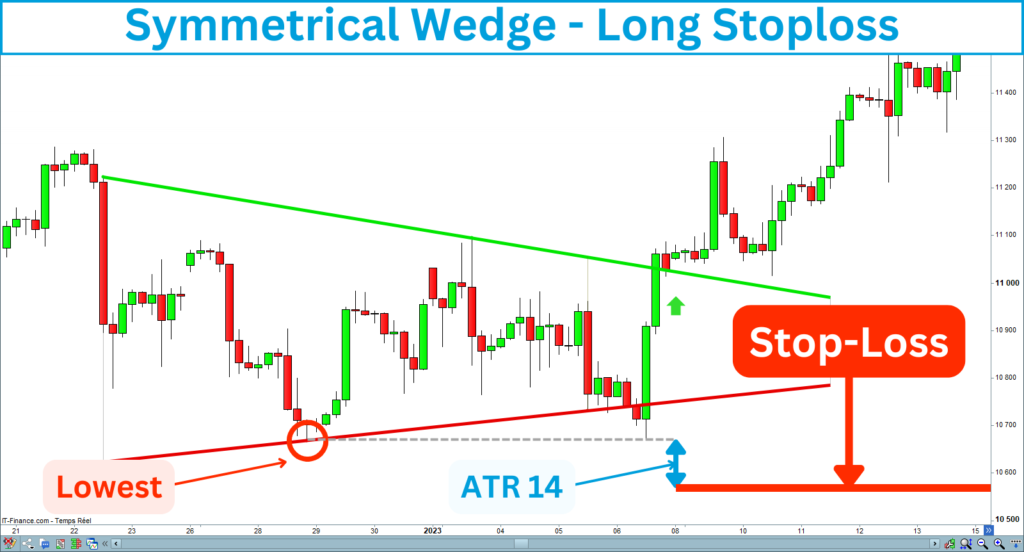
Long entry
Place the stop-loss below the last low construction point of the symmetrical wedge. Then, add a distance corresponding to an ATR 14 under this point. The following chart shows you where to place the stop-loss for a long entry:
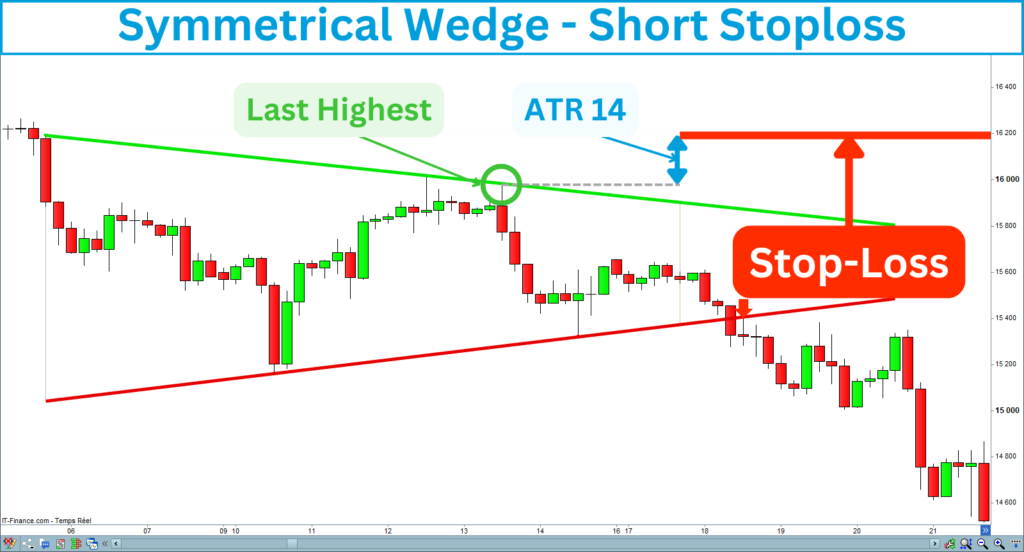
Short entry
Place the stop-loss above the last high construction point of the symmetrical wedge. Then, add a distance corresponding to an ATR 14 under this point. The following chart shows you where to place the stop-loss for a long entry:
8. Set the Target
Correctly setting your target will determine the money you will make with your trading. The trading strategy you have chosen will strongly impact the expected gains. Generally, long strategies offer more potential gain than short strategies. Besides, the success rate of the uptrend continuation signals is greater than the bullish reversal.
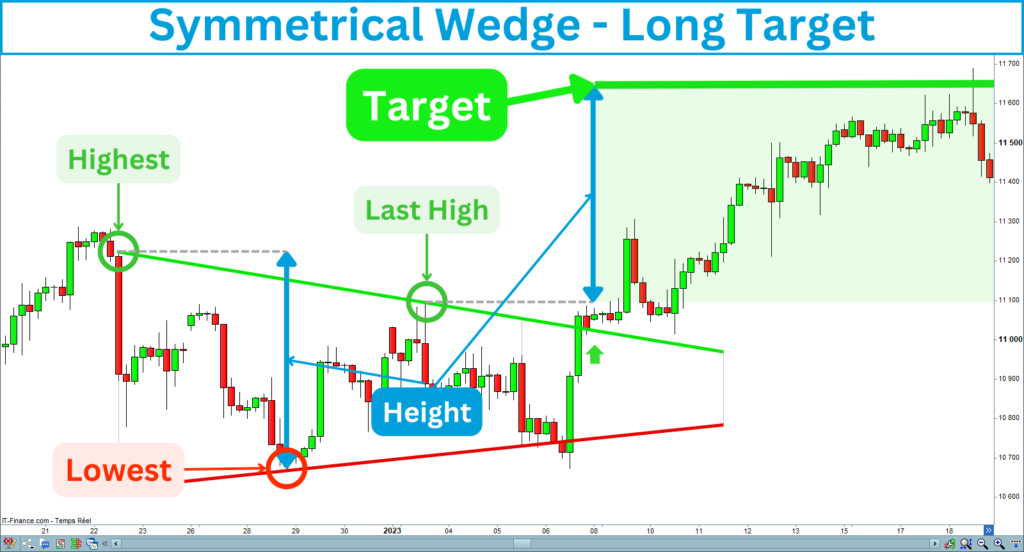
When trading the symmetrical wedge breakout strategy, you can set profit targets based on the height of the wedge. Many traders measure the distance between the widest part of the wedge to evaluate its height. I prefer to take the distance between the highest and lowest points of the figure.
After evaluating the wedge’s height, you have to project this distance to find the target. The direction of the projection depends on the direction of your trade. Here are the long and short target calculations:
Long entry
To determine the target for a long entry, you will need to project up the height from the last high construction point of the wedge:
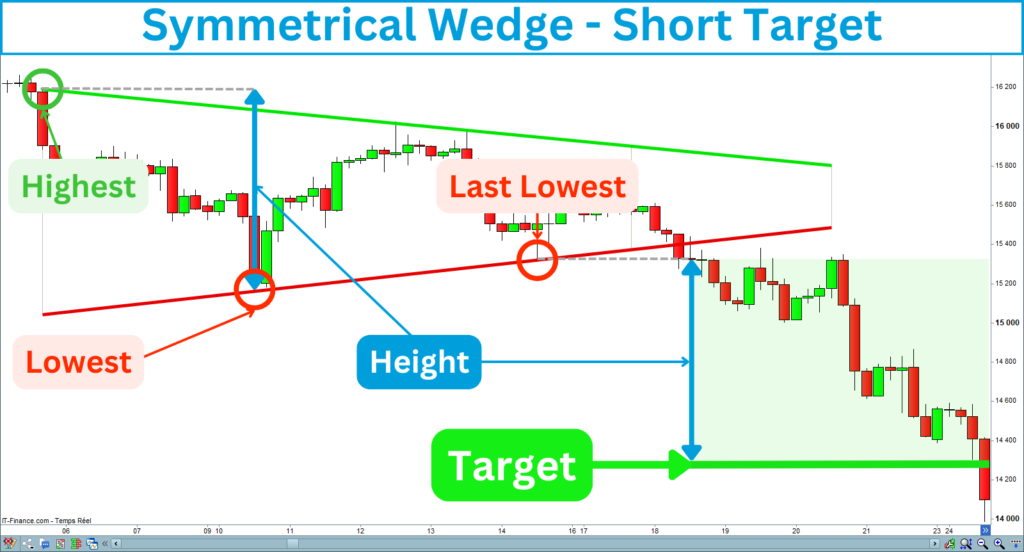
Short entry
To determine the target for a short entry, you will need to project down the height from the last low construction point of the wedge:
Alternatively, trailing stops can capture more of the move if the price continues to trend strongly after the target.
VI. Tips for Success with the Symmetrical Wedge Strategy
Here are some tips that will help you better trade the symmetrical wedges:
VII. Symmetrical Wedge Summary
The symmetrical wedge is a powerful tool that allows you to trade all types of markets.
You will be able to follow the trend as well as take reversal positions.
As a neutral pattern, the symmetrical wedges provide buying and selling signals.
Combined with strength filters, it delivers high-success-rate signals.
If you are interested in the symmetrical wedge strategy, I created an indicator that recognizes this pattern. It draws trend lines, detects breakouts, and displays the target and stop-loss.
The indicator is available on the marketplace of Prorealcode on this page:
https://market.prorealcode.com/product/ultimate-breaker
Have good trades 😊