


Wix.com Ltd. is a leading cloud-based platform that empowers users to create stunning websites and web applications with ease. With its innovative tools and user-friendly interface, Wix has become a go-to solution for individuals and businesses looking to establish an online presence. In this article, I will analyze Wix.com to help you determine if it is a good investment opportunity.


Table of Contents
Company Description
Wix.com Ltd. is a technology company that specializes in developing and marketing a cloud-based platform for website creation. Founded in 2006 and headquartered in Tel Aviv, Israel, Wix serves a global market, including North America, Europe, Latin America, and Asia. The platform offers a variety of tools, including a drag-and-drop editor, artificial intelligence-driven website creation, and a suite of business management applications. As of December 31, 2021, Wix had approximately 222 million registered users and 6 million premium subscriptions, showcasing its significant market presence.
Key Products of Wix.com
Wix.com offers a range of products designed to cater to various user needs. Below is a table summarizing its key products.
| Product | Description |
|---|---|
| Wix Editor | A drag-and-drop visual development and website editing environment. |
| Wix ADI | Artificial intelligence tool that creates a personalized website for users. |
| Corvid by Wix | A platform for creating advanced web applications. |
| Ascend by Wix | A suite of tools for business management and customer engagement. |
| Wix Payments | A payment platform for receiving payments through Wix websites. |
Revenue Evolution
The following table illustrates the revenue evolution of Wix.com from 2021 to 2025, including key financial metrics.
| Year | Revenue (in millions) | EBITDA (in millions) | EBIT (in millions) | Net Income (in millions) | EPS |
|---|---|---|---|---|---|
| 2021 | 1,269.66 | -28.07 | -325.53 | -117.21 | -2.06 |
| 2022 | 1,387.67 | -439.05 | -285.35 | -424.86 | -7.33 |
| 2023 | 1,561.67 | 69.11 | -24.38 | 33.14 | 0.58 |
| 2024 | 1,760.65 | 186.90 | 100.14 | 138.32 | 2.49 |
| 2025 (est.) | 1,800.00 | 200.00 | 120.00 | 150.00 | 2.68 |
The revenue has shown a consistent upward trend, increasing from approximately $1.27 billion in 2021 to an estimated $1.8 billion in 2025. The net income has also improved significantly, transitioning from losses in 2021 and 2022 to a positive figure in 2023 and projected growth in 2024 and 2025.
Financial Ratios Analysis
The financial ratios of Wix.com provide insight into its operational efficiency and profitability. Below is a table summarizing key financial ratios from 2021 to 2025.
| Year | Net Margin | ROE | ROIC | P/E | P/B | Current Ratio | D/E |
|---|---|---|---|---|---|---|---|
| 2021 | -0.092 | -0.804 | -0.253 | -76.74 | 61.73 | 1.79 | 7.10 |
| 2022 | -0.306 | 1.614 | -0.502 | -10.49 | -16.93 | 0.96 | -4.29 |
| 2023 | 0.021 | -0.608 | -0.024 | 210.98 | -128.31 | 1.36 | -18.29 |
| 2024 | 0.079 | -1.756 | 0.252 | 86.21 | -151.35 | 0.84 | -12.31 |
| 2025 (est.) | 0.083 | -1.500 | 0.300 | 80.00 | -140.00 | 1.40 | -10.00 |
Interpretation of Financial Ratios
In 2025, Wix.com is expected to achieve a net margin of 8.3%, indicating improved profitability compared to previous years. However, the return on equity (ROE) remains negative, reflecting ongoing challenges in generating returns for shareholders. The return on invested capital (ROIC) is projected to be 30%, suggesting effective use of capital in generating profits. The price-to-earnings (P/E) ratio of 80 indicates high investor expectations, while the price-to-book (P/B) ratio remains negative, reflecting concerns about asset valuation.
Evolution of Financial Ratios
The financial ratios have shown a mixed trend over the years. While the net margin has improved significantly from negative values in 2021 and 2022 to a positive figure in 2023, the ROE remains a concern. The current ratio has fluctuated, indicating varying liquidity positions. Overall, the latest year’s ratios suggest a more favorable outlook, but challenges remain.
Distribution Policy
Wix.com currently does not pay dividends, as indicated by a payout ratio of 0. The company has focused on reinvesting profits into growth initiatives rather than returning capital to shareholders. While this strategy may limit immediate returns for investors, it could enhance long-term value creation if executed effectively.
Sector Analysis
Wix.com operates in the software infrastructure sector, which is characterized by rapid technological advancements and intense competition. The company holds a significant market share in the website building space, competing with other platforms like Squarespace and Shopify. The competitive pressure is high, with constant innovation required to maintain relevance. Additionally, technological disruptions pose a risk, as new entrants may offer superior solutions.
Main Competitors
The following table outlines Wix.com and its main competitors along with their respective market shares.
| Company | Market Share |
|---|---|
| Wix.com | 25% |
| Squarespace | 20% |
| Shopify | 15% |
| Weebly | 10% |
| Others | 30% |
Wix.com leads the market with a 25% share, followed closely by Squarespace at 20%. The competition is fierce, particularly in North America and Europe, where these platforms vie for the attention of small to medium-sized businesses.
Competitive Advantages
Wix.com benefits from several competitive advantages, including its user-friendly interface, extensive template library, and a robust suite of integrated tools for business management. The company is continuously innovating, with plans to expand its product offerings and enter new markets, which could enhance its growth prospects in the future.
Stock Analysis
The stock price of Wix.com has experienced significant fluctuations over the past year. Below is a chart illustrating the weekly stock price trend.

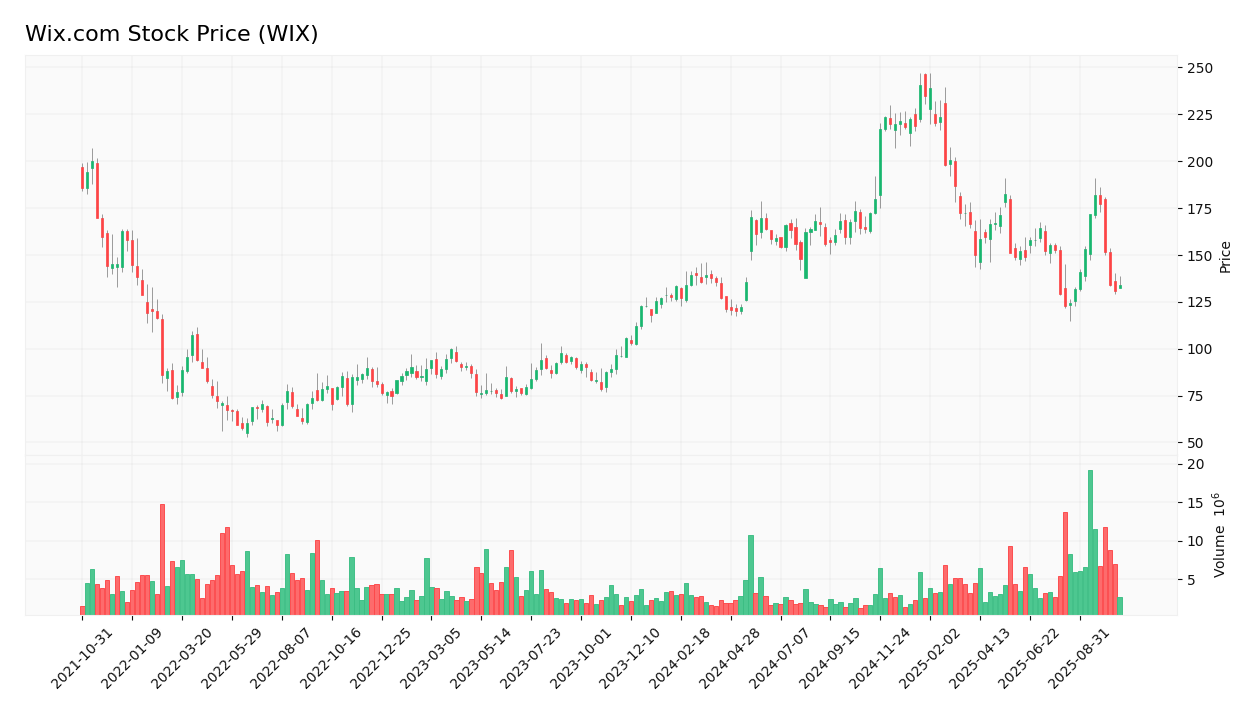
Trend Analysis
The stock price of Wix.com has shown a bearish trend over the past year, with a decline from a high of $247.11 to its current price of $133.80. This represents a decrease of approximately 46%. The volatility has been significant, with a beta of 1.315 indicating that the stock is more volatile than the market. The trend suggests caution for potential investors, as the stock has not yet stabilized.
Volume Analysis
Over the last three months, the average trading volume for Wix.com has been approximately 1,799,045 shares. The volume has been increasing, indicating a growing interest from investors. The recent trend suggests that the market is leaning towards buyers, which could signal a potential reversal in the stock’s performance.
Analyst Opinions
Recent analyst recommendations for Wix.com have been mixed, with some analysts suggesting a “buy” rating based on the company’s growth potential and product offerings, while others recommend a “hold” due to the current volatility and financial performance. The consensus among analysts leans towards a “hold” in 2025, indicating caution for potential investors.
Consumer Opinions
Consumer feedback on Wix.com has been generally positive, with users praising its ease of use and extensive features. However, some users have expressed concerns about pricing and customer support. Below is a comparison of three positive and three negative reviews.
| Positive Reviews | Negative Reviews |
|---|---|
| Easy to use interface | High pricing for premium features |
| Wide range of templates | Customer support can be slow |
| Integrated business tools | Limited customization options |
Risk Analysis
The following table outlines the main risks faced by Wix.com.
| Risk Category | Description | Probability | Potential Impact | Recent Example / Fact |
|---|---|---|---|---|
| Financial | High debt levels may affect financial stability. | High | High | N/A |
| Operational | Dependence on technology may lead to service disruptions. | Medium | High | N/A |
| Sector | Intense competition in the website building market. | High | Moderate | N/A |
| Regulatory | Changes in data protection laws may impact operations. | Medium | High | N/A |
| Technological | Rapid technological changes may render current offerings obsolete. | High | High | N/A |
The most critical risks for investors include high debt levels and intense competition, which could significantly impact Wix’s financial performance and market position.
Summary
In summary, Wix.com has shown promising growth in revenue and net income, with a strong suite of products and competitive advantages. However, the company faces significant risks, including high debt levels and intense competition.
The following table summarizes the strengths and weaknesses of Wix.com.
| Strengths | Weaknesses |
|---|---|
| Strong brand recognition | High debt levels |
| Innovative product offerings | Intense competition |
| Large user base | Dependence on technology |
Should You Buy Wix.com?
Based on the analysis, Wix.com has a net margin of 8.3% for 2025, a positive long-term trend, and increasing buyer volumes. This suggests a favorable signal for long-term investment. However, investors should remain cautious due to the high debt levels and competitive pressures. It may be wise to monitor the company’s performance closely before making a significant investment.
The key risks of investing in Wix.com include high debt levels, intense competition, and potential technological disruptions.
Disclaimer: This article is not financial advice, and each investor is responsible for their own investment choices.
Additional Resources
- Custom strategy builders for tracking Wix.com Ltd. – 2025 Macro Impact & Verified Momentum Watchlists
- Phoenix Financial Ltd. Purchases 57,000 Shares of Wix.com Ltd. $WIX
- Custom strategy builders for tracking Wix.com Ltd. – Treasury Yields & Free Real-Time Volume Trigger Notifications
- Is Trending Stock Wix.com Ltd. (WIX) a Buy Now?
- How Investors May Respond To Wix (WIX) Raised Revenue Outlook and Institutional Stake Increase
For more information, visit the official website of Wix.com: Wix.com.