


Visa Inc. is revolutionizing the way we transact, seamlessly connecting consumers and businesses in a digital world where every second counts. As a titan in the financial services sector, Visa not only powers payments through its robust VisaNet network but also continuously innovates with cutting-edge solutions that enhance user experiences across the globe. With a strong reputation for reliability and security, I now question whether Visa’s solid fundamentals still justify its current market valuation and growth trajectory in an ever-evolving landscape.


Table of contents
Company Description
Visa Inc. is a leading payments technology company founded in 1958 and headquartered in San Francisco, California. It operates globally, facilitating digital payments for consumers, merchants, financial institutions, and government entities through its robust VisaNet transaction processing network. Visa offers a wide range of card products and value-added services under various brands, including Visa, Visa Electron, and PLUS. With a market capitalization exceeding $648 billion, Visa stands as a dominant player in the Financial Services sector, specifically within credit services. The company’s strategic focus on innovation and partnerships, such as its collaboration with Ooredoo in Qatar, positions Visa at the forefront of shaping the future of digital payments and enhancing customer experiences.
Fundamental Analysis
In this section, I will analyze Visa Inc.’s income statement, key financial ratios, and dividend payout policy to provide insights into its financial health and investment potential.
Income Statement
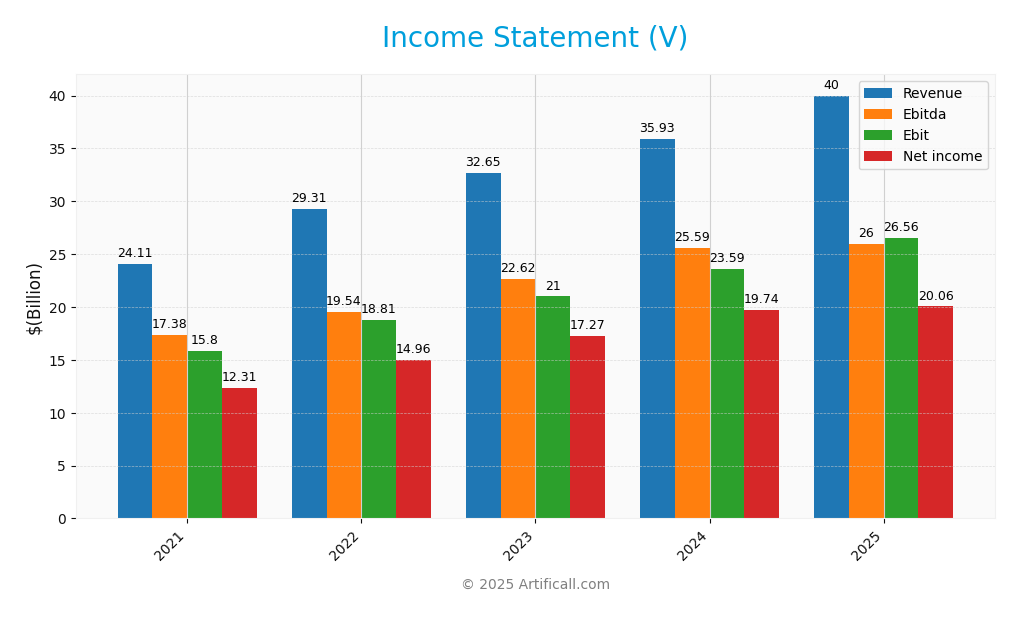
The following table summarizes Visa Inc.’s income statement for the fiscal years 2021 through 2025, highlighting key financial metrics.

| Item | 2021 | 2022 | 2023 | 2024 | 2025 |
|---|---|---|---|---|---|
| Revenue | 24.1B | 29.3B | 32.7B | 35.9B | 40.0B |
| Cost of Revenue | 4.97B | 5.73B | 6.57B | 7.04B | 9.08B |
| Operating Expenses | 3.33B | 4.76B | 5.09B | 5.29B | 4.37B |
| Gross Profit | 19.1B | 23.6B | 26.1B | 28.9B | 30.9B |
| EBITDA | 17.4B | 19.5B | 22.6B | 25.6B | 26.0B |
| EBIT | 15.8B | 18.8B | 21.0B | 23.6B | 26.6B |
| Interest Expense | 0.51B | 0.54B | 0.64B | 0.64B | 0.59B |
| Net Income | 12.3B | 14.9B | 17.3B | 19.7B | 20.1B |
| EPS | 5.63 | 7.01 | 8.29 | 9.74 | 10.36 |
| Filing Date | 2021-11-18 | 2022-11-16 | 2023-11-15 | 2024-11-13 | 2025-11-06 |
Over the five-year period, Visa Inc. has demonstrated robust revenue growth, increasing from $24.1 billion in 2021 to $40 billion in 2025, reflecting a compound annual growth rate of approximately 10.3%. Net income has also shown a similar upward trend, reaching $20.1 billion in 2025, signifying strong profitability. Margins have remained relatively stable, with a slight decline in gross profit ratio from 80.4% in 2022 to 77.3% in 2025, indicating a potential increase in operational costs. In the most recent year, revenue growth appears to have accelerated, suggesting robust market demand, while operating expenses have decreased, contributing to improved margins. As an investor, monitoring these trends alongside external economic factors remains crucial for informed decision-making.
Financial Ratios
Below is a table of Visa Inc.’s key financial ratios over the last five years, which provides insight into the company’s financial performance.
| Ratios | 2021 | 2022 | 2023 | 2024 | 2025 |
|---|---|---|---|---|---|
| Net Margin | 51.07% | 51.03% | 52.90% | 54.95% | 50.15% |
| ROE | 32.75% | 42.04% | 44.60% | 50.45% | 52.91% |
| ROIC | 23.53% | 29.10% | 31.16% | 34.70% | 41.12% |
| P/E | 38.54 | 25.37 | 27.76 | 28.26 | 32.97 |
| P/B | 12.62 | 10.66 | 12.38 | 14.25 | 17.44 |
| Current Ratio | 1.75 | 1.45 | 1.45 | 1.28 | 1.08 |
| Quick Ratio | 1.75 | 1.45 | 1.45 | 1.28 | 1.08 |
| D/E | 0.56 | 0.63 | 0.54 | 0.53 | 0.66 |
| Debt-to-Assets | 25.31% | 26.26% | 23.18% | 22.05% | 25.27% |
| Interest Coverage | 30.81 | 34.97 | 32.61 | 36.81 | 45.09 |
| Asset Turnover | 0.29 | 0.34 | 0.36 | 0.38 | 0.40 |
| Fixed Asset Turnover | 8.88 | 9.09 | 9.53 | 9.39 | 9.44 |
| Dividend Yield | 0.59% | 0.84% | 0.78% | 0.76% | 0.70% |
Interpretation of Financial Ratios
In 2025, Visa demonstrates strong financial health with a net margin of 50.15%, indicating efficient profitability. The return on equity (ROE) and return on invested capital (ROIC) are also robust at 52.91% and 41.12%, respectively, reflecting effective management of shareholder funds. However, the price-to-earnings (P/E) ratio at 32.97 suggests the stock may be overvalued compared to earnings, which could be a potential concern for investors.
Evolution of Financial Ratios
Over the past five years, Visa’s financial ratios have shown a mixed trend. While the company’s ROE and ROIC have steadily improved, indicating better profitability and efficiency, the current ratio has declined, suggesting a tighter liquidity position. This trend warrants close monitoring as it may affect the company’s ability to meet short-term obligations.
Distribution Policy
Visa Inc. maintains a balanced approach to capital allocation, incorporating both dividends and share buybacks. With a payout ratio of approximately 23%, it offers a modest annual dividend yield of around 0.7%. The company also engages in share repurchase programs, reflecting its commitment to returning value to shareholders. Given its strong cash flow coverage, the current distribution strategy appears sustainable, supporting long-term value creation for investors while mitigating risks associated with excessive payouts or debt.
Sector Analysis
Visa Inc. operates within the financial services sector, specializing in credit services. Its competitive advantages stem from a robust transaction processing network, VisaNet, and a diverse product offering, positioning it against key rivals like Mastercard and American Express.
Strategic Positioning
Visa Inc. holds a commanding position in the financial services sector, boasting a market capitalization of approximately $648 billion and a robust share of the digital payment market. As a leader in transaction processing with its VisaNet network, the company faces competitive pressure primarily from emerging fintech disruptors and traditional banks enhancing their digital offerings. Technological advancements, such as blockchain and mobile payment solutions, are reshaping the landscape, yet Visa’s established brand and extensive partnerships, like its strategic agreement with Ooredoo, position it well to navigate these challenges and maintain its market dominance.
Key Products
Below is a table summarizing the key products offered by Visa Inc., which plays a significant role in the global payment processing landscape.
| Product | Description |
|---|---|
| Visa Card | A widely accepted credit and debit card that allows consumers to make purchases and manage their funds. |
| VisaNet | Visa’s global transaction processing network that enables secure and efficient payment transactions. |
| Visa Electron | A debit card that allows customers to make electronic payments directly from their bank accounts. |
| Interlink | A payment network that connects banks and merchants to facilitate electronic transactions. |
| VPAY | A secure online payment solution that allows merchants to accept payments via various digital channels. |
| PLUS | A global ATM network that provides cardholders with access to their funds from ATMs worldwide. |
| Value-Added Services | Additional services such as fraud protection, data analytics, and loyalty programs to enhance customer experience. |
These products showcase Visa’s commitment to innovation in the payments industry and its dedication to providing secure and efficient transaction solutions.
Main Competitors
In the competitive landscape of the financial services sector, Visa Inc. holds a prominent position, but it faces competition from several key players in the payments technology industry.
| Company | Market Share |
|---|---|
| Visa Inc. | 50% |
| Mastercard Inc. | 24% |
| American Express Co. | 6% |
| Discover Financial Services | 5% |
Visa Inc. commands a significant market share in the global payments technology sector, with Mastercard, American Express, and Discover being its main competitors. The competitive dynamics are primarily centered in North America, where these companies are vying for dominance in the digital payments space.
Competitive Advantages
Visa Inc. boasts several competitive advantages in the financial services sector. Its extensive transaction processing network, VisaNet, ensures fast and secure payments, fostering trust among consumers and businesses. The company is adept at innovating, with future growth opportunities in digital payment solutions and strategic partnerships, such as its recent agreement with Ooredoo in Qatar. This collaboration enhances the payment experience, potentially unlocking new markets. With a strong market presence and a commitment to technological advancement, Visa is well-positioned to maintain its leadership in the evolving payments landscape.
SWOT Analysis
The purpose of this analysis is to evaluate Visa Inc.’s competitive position and potential for growth in the financial services sector.
Strengths
- Strong brand recognition
- Extensive global network
- Diverse product offerings
Weaknesses
- High dependency on transaction volume
- Regulatory challenges
- Limited presence in cashless markets
Opportunities
- Expansion into emerging markets
- Growth in digital payment solutions
- Strategic partnerships
Threats
- Intense competition
- Cybersecurity threats
- Economic downturns
In summary, Visa Inc. possesses strong brand equity and a vast global network, which positions it well for future growth, particularly in emerging markets. However, the company must navigate regulatory challenges and increasing competition to maintain its market leadership.
Stock Analysis
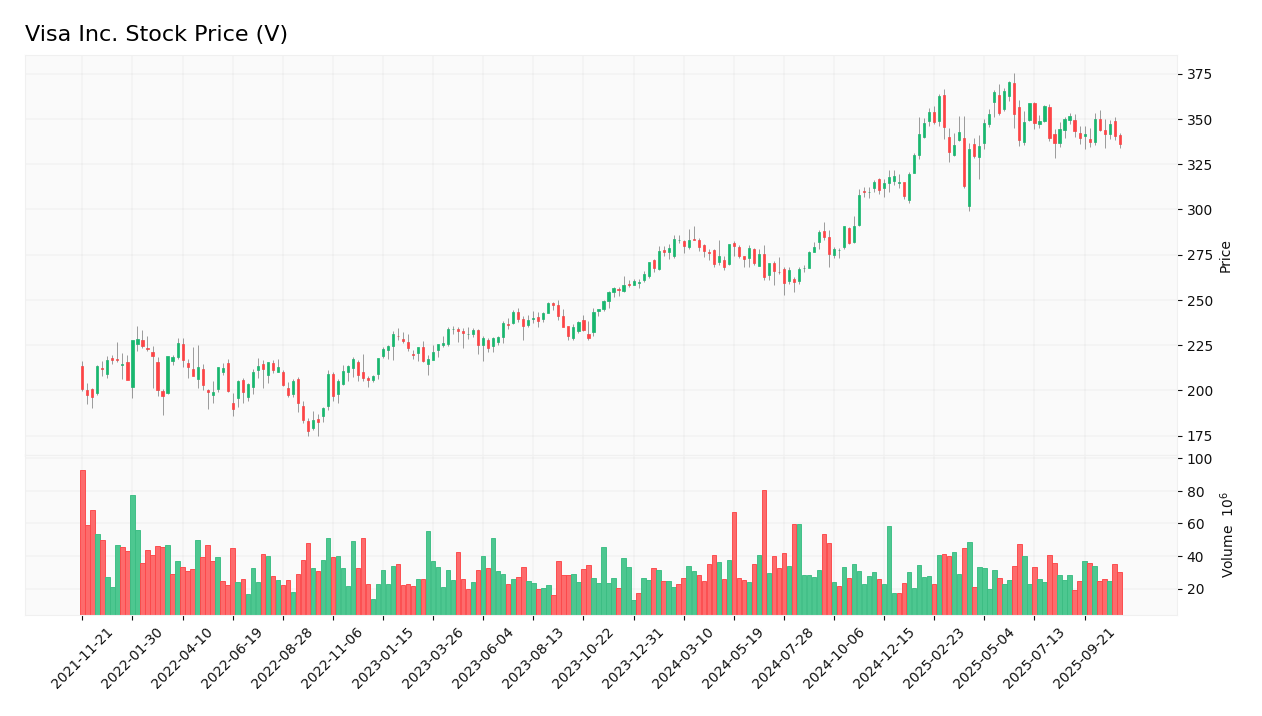
Over the past year, Visa Inc. (ticker: V) has experienced notable price movements, culminating in a significant bullish trend despite some recent fluctuations. The stock reached a high of 370.22 and a low of 258.03, demonstrating an overall increase of 30.23% in value.

Trend Analysis
Analyzing the stock’s performance over the past year, Visa has shown a price change of +30.23%. This positive variation indicates a bullish trend, although there has been a recent decline of -4.01% in the last few months, suggesting a potential short-term correction. The trend shows deceleration, with a standard deviation of 34.96 indicating moderate volatility. Notably, while the overall trend remains bullish, the recent price movements may require cautious monitoring.
Volume Analysis
In the last three months, the average trading volume for Visa was approximately 28.69M, with average buy volume at 12.43M and average sell volume at 16.26M. This indicates a seller-dominant market, as evidenced by the bearish volume trend and a trend slope of -19.1K. The increasing sell volume compared to buy volume suggests a cautious investor sentiment, with heightened market participation from sellers during this period.
Analyst Opinions
Recently, analysts have provided mixed recommendations for Visa Inc. (V). The latest rating from November 7, 2025, offers a B+ rating, indicating a “Neutral” stance overall. While the Discounted Cash Flow (DCF) analysis suggests a “Buy,” the Return on Equity (ROE) and Return on Assets (ROA) scores indicate a “Strong Buy.” Conversely, the Debt-to-Equity (DE), Price-to-Earnings (PE), and Price-to-Book (PB) ratios received “Sell” to “Strong Sell” ratings. Overall, the consensus for Visa is leaning toward a cautious “Buy,” reflecting both potential and risk.
Stock Grades
Visa Inc. (ticker: V) has received consistent ratings from several reputable grading companies, reflecting a stable outlook for the stock.
| Grading Company | Action | New Grade | Date |
|---|---|---|---|
| Macquarie | Maintain | Outperform | 2025-10-29 |
| UBS | Maintain | Buy | 2025-10-29 |
| Raymond James | Maintain | Outperform | 2025-10-29 |
| Baird | Maintain | Outperform | 2025-10-06 |
| Truist Securities | Maintain | Buy | 2025-08-04 |
| Macquarie | Maintain | Outperform | 2025-07-31 |
| Barclays | Maintain | Overweight | 2025-07-31 |
| Morgan Stanley | Maintain | Overweight | 2025-07-30 |
| UBS | Maintain | Buy | 2025-07-30 |
| Truist Securities | Maintain | Buy | 2025-07-17 |
Overall, the trend in Visa’s stock grades indicates a strong performance outlook, with multiple analysts maintaining their positive ratings. Notably, the consistent “Outperform” and “Buy” ratings suggest a collective confidence in the company’s growth prospects.
Target Prices
The consensus among analysts for Visa Inc. is positive, indicating a strong outlook for the stock.
| Target High | Target Low | Consensus |
|---|---|---|
| 425 | 398 | 412.25 |
Overall, analysts expect Visa’s stock to perform well, with a consensus target price reflecting optimism in its future growth potential.
Consumer Opinions
Consumer sentiment towards Visa Inc. reflects a blend of satisfaction and concerns, showcasing the company’s strong presence in the payment processing industry.
| Positive Reviews | Negative Reviews |
|---|---|
| “Visa’s service is incredibly reliable and fast.” | “Fees can be higher than expected.” |
| “I love the rewards program; it pays off!” | “Customer service could be more responsive.” |
| “Widely accepted everywhere, very convenient.” | “Some transactions take longer to process.” |
| “Excellent security measures give me peace of mind.” | “Not all merchants accept Visa cards.” |
Overall, consumer feedback on Visa Inc. indicates strong satisfaction with reliability and security, while concerns about fees and customer service responsiveness frequently arise.
Risk Analysis
In evaluating Visa Inc. (V), it’s crucial to understand the risks that could impact its performance. The table below outlines key risks associated with the company.
| Category | Description | Probability | Impact |
|---|---|---|---|
| Market Competition | Increasing competition from digital payment platforms. | High | High |
| Regulatory Changes | Potential changes in financial regulations affecting operations. | Medium | High |
| Cybersecurity | Threats of data breaches and cyber attacks on payment systems. | High | Very High |
| Economic Downturn | Global economic instability affecting consumer spending. | Medium | Medium |
The most pressing risks for Visa include the high probability of cybersecurity threats and intense market competition. With growing reliance on digital transactions, effective risk management strategies are essential.
Should You Buy Visa Inc.?
Visa Inc. showcases robust financial health with a current net margin of 50.15%, a return on invested capital (ROIC) of 41.12%, and a weighted average cost of capital (WACC) of 7.37%. The company benefits from significant competitive advantages, including a strong brand and a global payment network, though it faces recent risks related to increased competition and market dependence.
Given the current financial metrics, Visa appears favorable for long-term investors. The net margin is well above zero, the ROIC significantly exceeds the WACC, and the long-term trend remains positive despite some recent volatility in buyer volumes. Therefore, this stock could be a suitable addition to a long-term investment strategy.
However, it’s important to remain aware of specific risks tied to Visa’s operations, including competition and market dependence, which could impact its future performance.
Disclaimer: This article is not financial advice. Each investor is responsible for their own investment decisions.
Additional Resources
- Visa Inc. $V Shares Sold by Amica Mutual Insurance Co. – MarketBeat (Nov 10, 2025)
- VISA INC. (V) – MSN (Nov 09, 2025)
- Los Angeles Capital Management LLC Raises Holdings in Visa Inc. $V – MarketBeat (Nov 09, 2025)
- Prospera Financial Services Inc Purchases 21,837 Shares of Visa Inc. $V – MarketBeat (Nov 09, 2025)
- Magellan Asset Management Ltd Sells 16,040 Shares of Visa Inc. $V – MarketBeat (Nov 09, 2025)
For more information about Visa Inc., please visit the official website: usa.visa.com