


Unity Software Inc. is revolutionizing the way we experience digital content, from immersive gaming to architectural visualizations. As a powerhouse in the real-time 3D content platform industry, Unity empowers creators across various sectors with innovative solutions that enhance interactivity and engagement. With a strong reputation for quality and a commitment to pushing technological boundaries, Unity’s role in shaping the future of digital experiences is undeniable. As we analyze its current market standing, we must ask: do the fundamentals still align with its growth potential and market valuation?

Table of contents
Company Description
Unity Software Inc. is a leading technology company founded in 2004 and headquartered in San Francisco, California. Specializing in interactive real-time 3D content, Unity offers a robust platform for developers, artists, and engineers to create, run, and monetize engaging 2D and 3D experiences across various devices, including mobile phones, tablets, PCs, consoles, and VR/AR hardware. With a diverse market presence that spans the globe, including significant operations in North America, Europe, and Asia, Unity serves a wide array of clients through its online store and various sales channels. As a pivotal player in the software application industry, Unity is recognized for its innovative solutions that shape the landscape of interactive content creation, positioning the company at the forefront of the digital entertainment revolution.
Fundamental Analysis
In this section, I will analyze Unity Software Inc.’s income statement, key financial ratios, and its payout policy to provide a comprehensive view of its financial health.
Income Statement
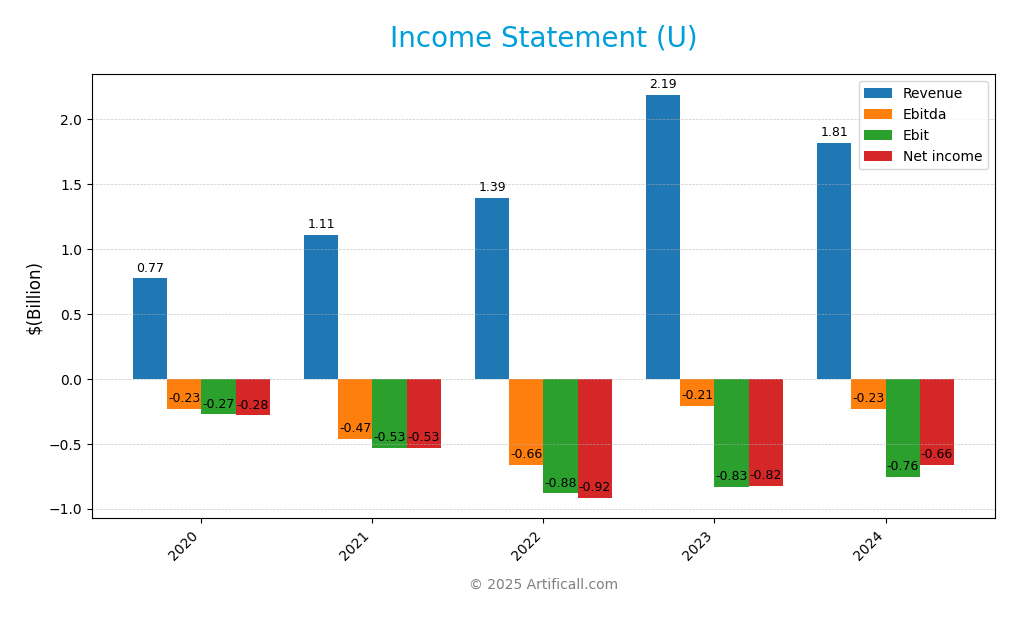
Below is the Income Statement for Unity Software Inc., illustrating key financial metrics over the past five years, which can help you analyze the company’s performance trends.

| 2020 | 2021 | 2022 | 2023 | 2024 | |
|---|---|---|---|---|---|
| Revenue | 772M | 1111M | 1391M | 2187M | 1813M |
| Cost of Revenue | 172M | 254M | 442M | 734M | 481M |
| Operating Expenses | 875M | 1389M | 1831M | 2286M | 2088M |
| Gross Profit | 600M | 857M | 949M | 1454M | 1332M |
| EBITDA | -232M | -532M | -663M | -209M | -235M |
| EBIT | -275M | -532M | -882M | -833M | -755M |
| Interest Expense | 5M | 1M | 7M | 25M | 24M |
| Net Income | -282M | -533M | -919M | -822M | -664M |
| EPS | -1.66 | -1.89 | -2.96 | -2.16 | -1.68 |
| Filing Date | 2021-03-05 | 2022-02-22 | 2023-02-27 | 2024-02-29 | 2025-02-21 |
Over the examined period, Unity Software Inc. experienced fluctuations in revenue, peaking in 2023 at $2.187 billion before declining to $1.813 billion in 2024. This decline is concerning as it may indicate market challenges or increased competition. Meanwhile, net income has shown a similar downward trend, indicating persistent operational losses, which have slightly decreased from $822 million in 2023 to $664 million in 2024. The gross margin has remained relatively stable, but the increase in operating expenses highlights a need for improved cost management. The 2024 performance suggests a slowdown in revenue growth coupled with ongoing net losses, necessitating a closer examination of strategic adjustments to reverse this trend.
Financial Ratios
Below is a summary table of Unity Software Inc.’s key financial ratios over the last five years.
| Ratios | 2020 | 2021 | 2022 | 2023 | 2024 |
|---|---|---|---|---|---|
| Net Margin | -36.5% | -47.9% | -66.1% | -37.6% | -36.6% |
| ROE | -13.9% | -22.2% | -26.1% | -25.8% | -20.8% |
| ROIC | -12.7% | -12.6% | -12.9% | -13.1% | -12.9% |
| P/E | N/A | N/A | N/A | N/A | N/A |
| P/B | 12.81 | 16.85 | 2.52 | 4.89 | 2.79 |
| Current Ratio | 4.13 | 3.44 | 2.34 | 2.60 | 2.50 |
| Quick Ratio | 4.13 | 3.44 | 2.34 | 2.60 | 2.50 |
| D/E | 0.06 | 0.76 | 0.77 | 0.85 | 0.74 |
| Debt-to-Assets | 4.64% | 37.6% | 34.6% | 37.4% | 34.9% |
| Interest Coverage | -50.84 | -470.08 | -119.15 | -33.88 | -32.08 |
| Asset Turnover | 0.29 | 0.23 | 0.18 | 0.30 | 0.27 |
| Fixed Asset Turnover | 3.88 | 10.47 | 11.41 | 15.53 | 18.35 |
| Dividend Yield | 0% | 0% | 0% | 0% | 0% |
Interpretation of Financial Ratios
In the most recent year, Unity Software Inc.’s financial ratios indicate significant challenges. The negative net margin and ROE reflect ongoing losses, while a current ratio above 2 suggests sufficient liquidity. However, the high D/E ratio indicates a reliance on debt financing, which raises concerns about financial stability. Overall, these factors suggest caution for potential investors.
Evolution of Financial Ratios
Over the past five years, Unity’s financial ratios have shown a concerning trend, particularly with worsening profitability indicated by declining net margins and ROE. While liquidity ratios have remained relatively stable, the increasing debt levels are worrisome, highlighting potential risks in the company’s financial health.
Distribution Policy
Unity Software Inc. does not currently pay dividends, as it is in a high-growth phase prioritizing reinvestment in research and development. This strategy aligns with long-term shareholder value creation by focusing on innovation and market expansion. Additionally, the company engages in share buybacks, reflecting confidence in its future prospects. However, the lack of dividends and ongoing operating losses introduce risks, making it essential for investors to assess the sustainability of this approach for future growth.
Sector Analysis
Unity Software Inc. operates in the interactive real-time 3D content platform sector, offering innovative solutions to developers and creators, competing primarily with Epic Games and Autodesk.
Strategic Positioning
Unity Software Inc. has established itself as a prominent player in the interactive real-time 3D content platform market, holding a significant market share within the software application industry. As of now, the company faces competitive pressure from other established players, yet it continues to innovate and adapt, positioning itself well against potential technological disruptions. The company’s focus on serving diverse sectors—including gaming, architecture, and augmented reality—enables it to benchmark effectively against its peers, ensuring it remains relevant and competitive in a rapidly evolving landscape.
Key Products
Unity Software Inc. offers a range of innovative products that cater to various sectors within the interactive content creation industry. Below is a table summarizing some of their key products:
| Product | Description |
|---|---|
| Unity Engine | A leading real-time 3D development platform used for creating interactive content across multiple platforms, including mobile, console, and VR/AR devices. |
| Unity Asset Store | An online marketplace where developers can buy and sell assets, tools, and plugins to enhance their projects, streamlining the development process. |
| Unity Reflect | A tool designed for architects and designers, allowing them to create interactive 3D experiences from BIM data, facilitating collaboration and visualization. |
| Unity MARS | A solution for developing AR applications, enabling creators to build intelligent AR experiences that understand and respond to the physical environment. |
| Unity Collaborate | A cloud-based collaboration tool that allows teams to work together in real-time, sharing updates and assets seamlessly during the development process. |
These products support Unity’s mission to empower creators and developers, providing them with the essential tools to build engaging and immersive experiences.
Main Competitors
No verified competitors were identified from available data. However, Unity Software Inc. operates in the competitive software application sector, focusing on interactive real-time 3D content creation. Given its market capitalization of approximately $17.13 billion, Unity holds a significant position within the technology sector, catering primarily to content creators and developers across various geographic markets, including North America, Europe, and Asia.
Competitive Advantages
Unity Software Inc. possesses significant competitive advantages due to its robust real-time 3D content platform, which caters to a diverse range of industries, including gaming, architecture, and virtual reality. The company’s innovative solutions empower creators and developers to produce high-quality interactive content efficiently. Looking ahead, Unity is poised to capitalize on emerging markets and trends, such as augmented reality and the metaverse, by expanding its product offerings and enhancing user experience. This strategic focus on innovation and market expansion positions Unity strongly for future growth opportunities.
SWOT Analysis
The following SWOT analysis evaluates Unity Software Inc. to understand its current position and strategic direction.
Strengths
- Strong market position
- Innovative technology
- Diverse customer base
Weaknesses
- High operational costs
- Dependence on game industry
- Limited profitability
Opportunities
- Growth in augmented reality
- Increasing demand for 3D content
- Expansion into new markets
Threats
- Intense competition
- Rapid technology changes
- Economic downturns
The overall SWOT assessment indicates that while Unity Software Inc. possesses significant strengths and opportunities, it must address its weaknesses and threats to maintain its competitive edge and ensure sustainable growth. A strategic focus on cost management and market diversification could enhance its resilience in a dynamic industry.
Stock Analysis
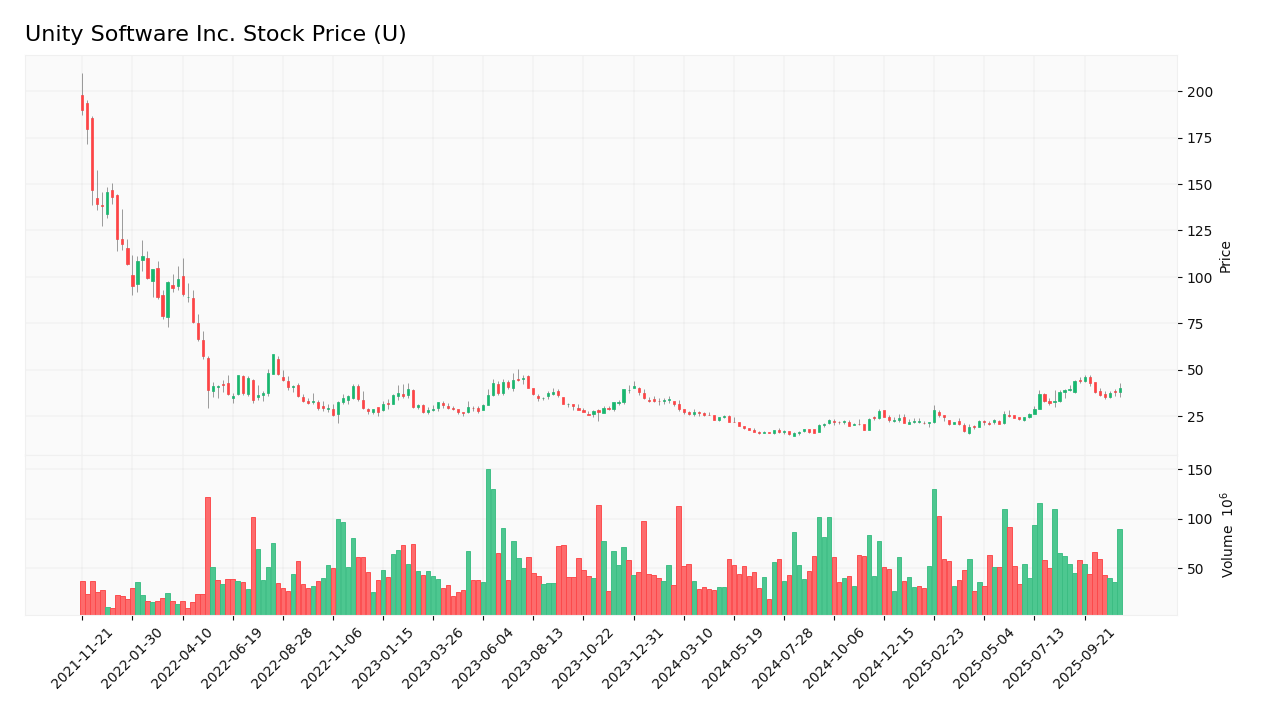
Over the past year, Unity Software Inc. (ticker: U) has experienced notable price movements, characterized by a bullish trend despite recent deceleration. Understanding these dynamics is crucial for informed investment decisions.

Trend Analysis
Analyzing the stock’s performance over the last two years, the price has changed by approximately 1.7%. The overall trend remains bullish, although it is currently showing signs of deceleration. The volatility is moderate, with a standard deviation of 7.91, indicating some fluctuations around the trend. During this period, the stock reached a high of 46.05 and a low of 15.32, showcasing significant price variability.
Volume Analysis
In the last three months, Unity’s trading volumes have indicated a buyer-dominant activity, with an average volume of approximately 54.34M. This represents an increase in overall trading activity, suggesting positive investor sentiment and a growing market participation. The average buy volume was 28.84M, compared to an average sell volume of 25.51M, further emphasizing the bullish volume trend, which has shown an acceleration with a trend slope of 223.28K.
Analyst Opinions
Recent analyst recommendations for Unity Software Inc. (ticker: U) indicate a bearish outlook. On November 7, 2025, an analyst assigned a rating of D+, categorizing it as a “Strong Sell.” This stance is supported by concerns regarding the company’s financial metrics, including poor scores in DCF, ROE, ROA, and PE ratios, all reflecting significant weaknesses. The consensus among analysts leans heavily towards selling, suggesting that investors should exercise caution and consider alternative opportunities.
Stock Grades
No verified stock grades were available from recognized analysts for Unity Software Inc. (ticker: U). As such, I recommend keeping an eye on market trends and investor sentiment surrounding this stock, as it continues to evolve in a competitive landscape.
Target Prices
No verified target price data is available from recognized analysts for Unity Software Inc. (Ticker: U). The current market sentiment around the stock appears mixed, with investors weighing its growth potential against broader market conditions.
Consumer Opinions
Consumer sentiment about Unity Software Inc. showcases a mix of enthusiasm and critique, reflecting the diverse experiences of its users.
| Positive Reviews | Negative Reviews |
|---|---|
| “Unity’s user interface is incredibly intuitive.” | “Customer support is lacking and slow to respond.” |
| “The asset store has a great selection of tools.” | “High system requirements limit accessibility.” |
| “Excellent for game development and 3D modeling.” | “Frequent updates can disrupt ongoing projects.” |
Overall, consumer feedback on Unity Software Inc. indicates a strong appreciation for its user-friendly tools and asset library, while concerns about customer support and system demands are frequently noted as areas needing improvement.
Risk Analysis
In evaluating Unity Software Inc. (ticker: U), it’s essential to consider various risks that could affect its performance and stock value. Below is a table summarizing these risks.
| Category | Description | Probability | Impact |
|---|---|---|---|
| Market Risk | Fluctuations in demand for gaming and AR/VR products. | High | High |
| Competition Risk | Intense competition from other software platforms. | High | High |
| Regulatory Risk | Changes in regulations affecting software development. | Medium | Medium |
| Technological Risk | Rapid changes in technology could outdate current products. | High | High |
| Economic Risk | Broader economic downturn affecting consumer spending. | Medium | High |
The most likely and impactful risks for Unity include market and competition risks, as the gaming and AR/VR markets evolve rapidly. Recent trends indicate increasing competition, which could pressure margins.
Should You Buy Unity Software Inc.?
Unity Software Inc. has faced significant challenges recently, with flagship products focusing on real-time 3D development, yet it struggles with financial ratios showing a negative net margin and poor returns. The company’s net margin stands at -36.63%, while the Return on Invested Capital (ROIC) is also negative, indicating that it is not generating adequate returns relative to its cost of capital (WACC).
Given that the net margin is negative, it is prudent to recommend waiting until fundamentals improve. The long-term trend appears bullish, but the current negative financials suggest caution. Additionally, while recent buyer volumes indicate interest, the overall picture remains concerning.
Specific risks to consider include intense competition in the tech space, potential supply chain disruptions, and a reliance on a volatile market for its services.
Disclaimer: This article is not financial advice. Each investor is responsible for their own investment decisions.
Additional Resources
- Unity Software Inc (U) Q3 2025 Earnings Call Highlights: Strong Financial Performance and … – Yahoo Finance (Nov 05, 2025)
- Unity Software’s ‘Vector’ Tech Is Beating Expectations, Fueling Analyst Optimism For 2026 – Benzinga (Nov 07, 2025)
- Unity’s Strategic Moves Propel Stock Forward – StocksToTrade (Nov 05, 2025)
- Unity Software Stock Ready for Next Leg Higher – Schaeffer’s Investment Research (Nov 05, 2025)
- Unity Software jumps amid strong Q3 results, guidance (U:NYSE) – Seeking Alpha (Nov 05, 2025)
For more information about Unity Software Inc., please visit the official website: unity.com