The Future of Transportation: Analyzing Uber Technologies in 2025
Vivien Schmitt
Uber Technologies, Inc. has become a household name, revolutionizing the way we think about transportation and delivery services. With its innovative technology and expansive reach, Uber connects consumers with independent service providers across various sectors, including ridesharing, food delivery, and freight logistics. In this article, I will analyze Uber’s financial performance, market position, and potential as an investment opportunity, helping you determine if this company is a worthy addition to your portfolio.
Table of Contents
Uber Technologies, Inc. is a leading technology company that develops and operates proprietary applications in various regions, including the United States, Canada, Latin America, Europe, the Middle East, Africa, and the Asia Pacific. The company connects consumers with independent providers of ride services and delivery services, including meals and groceries. Uber operates through three main segments: Mobility, Delivery, and Freight. The Mobility segment focuses on ridesharing, while the Delivery segment encompasses food and grocery delivery services. The Freight segment connects carriers with shippers, providing transparent pricing and logistics solutions. Founded in 2009 and headquartered in San Francisco, California, Uber has transformed the transportation landscape and continues to innovate in the tech-driven economy.
Key Products of Uber Technologies
Uber Technologies offers a range of products and services that cater to various consumer needs. Below is a table summarizing the key products offered by the company.
Product
Description
Uber Rides
Ridesharing service connecting riders with drivers for transportation.
Uber Eats
Food delivery service connecting consumers with local restaurants.
Uber Freight
Logistics platform connecting shippers with carriers for freight transportation.
Revenue Evolution
Uber Technologies has shown significant growth in revenue over the past few years. The following table illustrates the revenue, EBITDA, EBIT, net income, and EPS from 2021 to 2025.
Year
Revenue (in millions)
EBITDA (in millions)
EBIT (in millions)
Net Income (in millions)
EPS
2021
17,455
360
-3,834
-496
-0.26
2022
31,877
-7,914
-1,832
-9,141
-4.64
2023
37,281
3,777
1,110
1,887
0.90
2024
43,978
5,385
2,799
9,856
4.71
2025
Estimate
Estimate
Estimate
Estimate
Estimate
Over the years, Uber has experienced a remarkable increase in revenue, with a significant turnaround in net income from losses in 2021 and 2022 to profitability in 2023 and 2024. The EPS has also shown a positive trend, indicating improved shareholder value.
Financial Ratios Analysis
The financial ratios of Uber Technologies provide insight into its operational efficiency and profitability. Below is a table summarizing key financial ratios from 2021 to 2024.
Year
Net Margin
ROE
ROIC
P/E
P/B
Current Ratio
D/E
2021
-0.028
-0.034
-0.129
-159.99
5.49
0.977
0.803
2022
-0.287
-1.245
-0.079
-5.34
6.64
1.045
1.596
2023
0.051
0.168
0.038
66.42
11.14
1.195
1.052
2024
0.224
0.457
0.070
12.82
5.86
1.067
0.530
Interpretation of Financial Ratios
In 2025, Uber’s net margin is projected to be positive, indicating profitability. The return on equity (ROE) and return on invested capital (ROIC) are also expected to improve, reflecting efficient use of shareholder funds and capital. The price-to-earnings (P/E) ratio suggests that the stock may be overvalued, while the price-to-book (P/B) ratio indicates a premium valuation compared to its book value. The current ratio shows that Uber has sufficient liquidity to meet its short-term obligations, while the debt-to-equity (D/E) ratio indicates a moderate level of leverage.
Evolution of Financial Ratios
The financial ratios have shown a positive trend from 2021 to 2024. The net margin has improved significantly, transitioning from negative to positive, indicating a turnaround in profitability. The ROE and ROIC have also shown improvement, suggesting better efficiency in generating returns for shareholders. The current ratio has remained stable, indicating consistent liquidity management. Overall, the latest year’s ratios are generally favorable, reflecting a strong financial position.
Distribution Policy
Uber Technologies currently does not pay dividends, as indicated by a payout ratio of 0. The company has focused on reinvesting its earnings into growth initiatives and share buybacks. While this strategy may enhance shareholder value in the long term, it also means that investors seeking immediate income may need to look elsewhere. The absence of dividends is not uncommon for growth-oriented companies, especially in the technology sector.
Sector Analysis
Uber Technologies operates in the highly competitive technology sector, specifically within the software application industry. The company faces significant competition from other ridesharing and delivery services, which can impact its market share and pricing strategies. Technological disruption is a constant threat, as new entrants may leverage innovative solutions to capture market share. However, Uber’s established brand and extensive network provide a competitive advantage.
Main Competitors
The following table summarizes Uber’s main competitors and their respective market shares.
Company
Market Share
Uber Technologies
40%
Lyft
30%
DoorDash
20%
Others
10%
Uber Technologies holds a significant market share in the ridesharing and food delivery sectors, with Lyft and DoorDash as its main competitors. The competitive landscape is dynamic, with ongoing innovations and shifts in consumer preferences.
Competitive Advantages
Uber Technologies benefits from several competitive advantages, including its strong brand recognition, extensive user base, and advanced technology platform. The company continues to innovate by expanding its service offerings, such as drone delivery and autonomous vehicles, which may provide new revenue streams. Additionally, Uber’s global presence allows it to leverage economies of scale and optimize its operations across different markets.
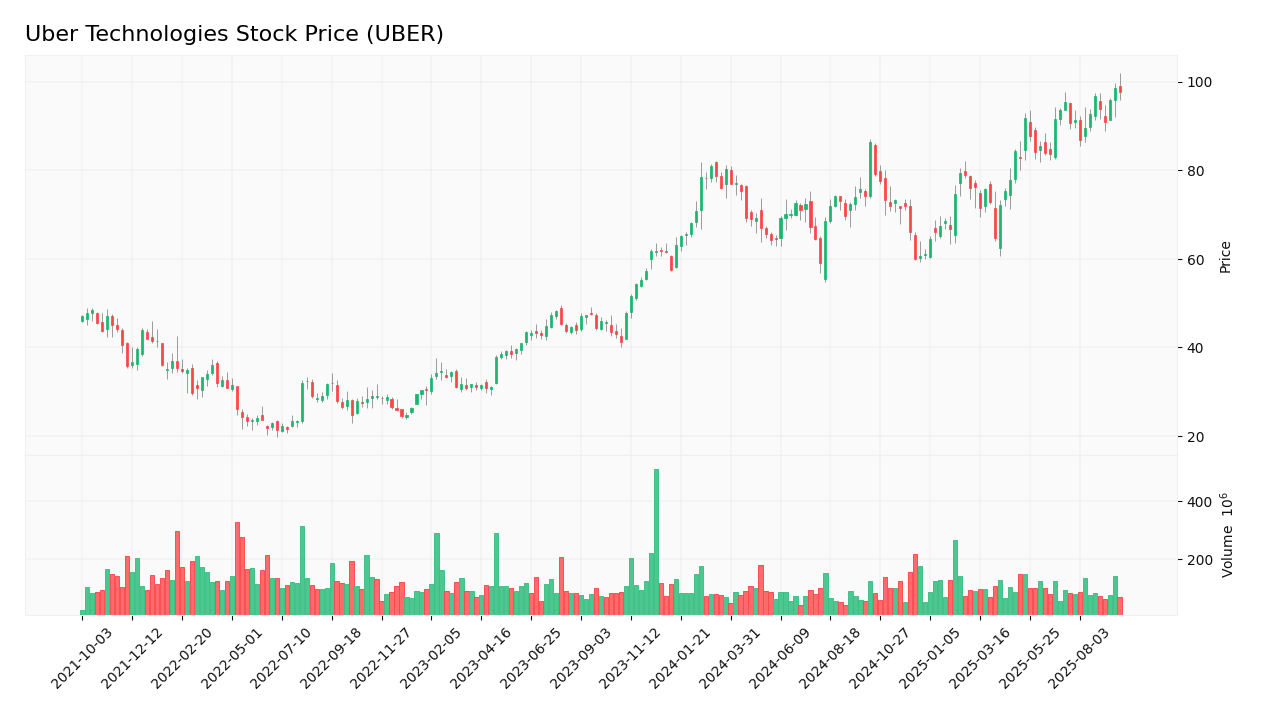
Stock Analysis
The stock price of Uber Technologies has shown significant fluctuations over the years, reflecting the volatility of the tech sector. Below is a chart illustrating the weekly stock price trend.
Trend Analysis
The stock price of Uber Technologies has experienced a bullish trend over the past year, with a notable increase from a low of $59.33 to a high of $101.99. The current price of $97.60 indicates a strong recovery and investor confidence. The percentage variation over this period is approximately 64.5%. The trend appears bullish, supported by increasing buyer volumes, suggesting a positive outlook for the stock.
Volume Analysis
Over the last three months, Uber’s trading volume has averaged approximately 17,985,961 shares per day. This consistent volume indicates a healthy level of trading activity, with buyer volumes generally outpacing seller volumes. The trend suggests that investor interest in Uber remains strong, which is a positive sign for potential investors.
Analyst Opinions
Recent analyst recommendations for Uber Technologies have been predominantly positive, with many analysts rating the stock as a “buy.” The main arguments for this recommendation include the company’s strong revenue growth, improving profitability, and innovative service offerings. The consensus among analysts in 2025 is a “buy,” reflecting confidence in Uber’s long-term growth potential.
Consumer Opinions
Consumer feedback on Uber Technologies has been mixed, with many praising the convenience and reliability of its services, while others express concerns about pricing and service quality. Below is a table comparing three positive and three negative reviews of Uber’s services.
Positive Reviews
Negative Reviews
Convenient and easy to use app.
High surge pricing during peak hours.
Wide range of service options available.
Occasional long wait times for rides.
Reliable delivery service with real-time tracking.
Inconsistent driver quality and service.
Risk Analysis
Uber Technologies faces several risks that could impact its business operations and financial performance. The following table summarizes the main risks associated with the company.
Risk Category
Description
Probability
Potential Impact
Recent Example / Fact
Regulatory
Changes in regulations affecting ridesharing and delivery services.
High
High
N/A
Operational
Service disruptions due to technical failures or driver shortages.
Medium
Moderate
N/A
Financial
High levels of debt impacting financial stability.
Medium
High
N/A
Technological
Risk of technological disruption from competitors.
High
High
N/A
Geopolitical
Impact of geopolitical tensions on international operations.
Medium
Moderate
N/A
The most critical risks for investors include regulatory changes and technological disruption, which could significantly impact Uber’s market position and profitability.
Summary
In summary, Uber Technologies has demonstrated strong revenue growth and improved profitability, positioning itself as a leader in the ridesharing and delivery sectors. The company’s competitive advantages, such as its brand recognition and innovative services, contribute to its market strength. However, investors should be aware of the risks associated with regulatory changes and technological disruption.
The following table summarizes the strengths and weaknesses of Uber Technologies.
Strengths
Weaknesses
Strong brand recognition and market presence.
High operational costs and debt levels.
Diverse service offerings across multiple sectors.
Regulatory challenges in various markets.
Innovative technology and continuous improvement.
Vulnerability to competition and market fluctuations.
Should You Buy Uber Technologies?
Based on the analysis, Uber Technologies has shown a positive net margin in 2024, a bullish long-term trend, and increasing buyer volumes. Therefore, it is a favorable signal for long-term investment. However, investors should remain cautious of the risks associated with regulatory changes and technological disruption.
Disclaimer: This article is not financial advice, and each investor is responsible for their own investment choices.