Unlock Your Investment Potential: A Deep Dive into P&G’s 2025 Outlook
Vivien Schmitt
The Procter & Gamble Company (P&G) is a global leader in consumer packaged goods, known for its extensive portfolio of trusted brands. With a history dating back to 1837, P&G has established itself as a household name, providing products that cater to various consumer needs across beauty, grooming, health care, fabric and home care, and baby, feminine, and family care segments. In this article, I will analyze the company’s financial performance, market position, and potential as an investment opportunity, helping you determine if P&G is a suitable addition to your portfolio.
Table of Contents
The Procter & Gamble Company is a multinational consumer goods corporation headquartered in Cincinnati, Ohio. It operates in five main segments: Beauty, Grooming, Health Care, Fabric & Home Care, and Baby, Feminine & Family Care. P&G’s products are sold in over 180 countries, primarily through mass merchandisers, e-commerce platforms, grocery stores, and drug stores. The company is committed to innovation and sustainability, continuously adapting to changing consumer preferences and market dynamics.
Key Products of The Procter & Gamble Company
The following table outlines some of the key products offered by The Procter & Gamble Company:
Product
Description
Head & Shoulders
Shampoo and conditioner for dandruff control.
Pantene
Hair care products including shampoos and conditioners.
Gillette
Shaving products and razors for men.
Crest
Toothpaste and oral care products.
Tide
Laundry detergent and fabric care products.
Pampers
Diapers and baby care products.
Olay
Skin care products including moisturizers and cleansers.
Vicks
Cold and flu relief products.
Revenue Evolution
The following table presents the revenue, EBITDA, EBIT, net income, and EPS of The Procter & Gamble Company from 2021 to 2025:
Year
Revenue (in millions)
EBITDA (in millions)
EBIT (in millions)
Net Income (in millions)
EPS
2021
76,118
20,852
17,986
14,352
5.69
2022
80,187
21,241
17,813
14,742
6.00
2023
82,006
21,771
18,134
14,653
6.07
2024
84,039
22,582
18,545
14,879
6.18
2025
84,284
23,921
20,451
15,974
6.67
The revenue of The Procter & Gamble Company has shown a steady increase over the past five years, with net income and EPS also reflecting positive growth. The company has successfully navigated market challenges, resulting in a robust financial performance.
Financial Ratios Analysis
The following table summarizes key financial ratios for The Procter & Gamble Company from 2021 to 2025:
Year
Net Margin
ROE
ROIC
P/E
P/B
Current Ratio
D/E
2021
0.1879
0.3085
0.2087
23.71
7.31
0.6969
0.7081
2022
0.1838
0.3164
0.2117
23.97
7.58
0.6545
0.6931
2023
0.1787
0.3133
0.2132
24.52
7.68
0.6334
0.7573
2024
0.1770
0.2959
0.2090
25.81
7.64
0.7348
0.6636
2025
0.1895
0.3055
0.2293
24.48
7.48
0.7042
0.6600
Interpretation of Financial Ratios
In 2025, The Procter & Gamble Company demonstrated a net margin of 18.95%, indicating strong profitability. The return on equity (ROE) was 30.55%, reflecting effective management of shareholder equity. The return on invested capital (ROIC) was 22.93%, suggesting efficient use of capital. The price-to-earnings (P/E) ratio of 24.48 indicates that investors are willing to pay a premium for the company’s earnings, while the price-to-book (P/B) ratio of 7.48 suggests a high valuation relative to its book value. The current ratio of 0.7042 indicates that the company may face liquidity challenges, while the debt-to-equity (D/E) ratio of 0.6600 shows a moderate level of debt.
Evolution of Financial Ratios
The financial ratios of The Procter & Gamble Company have shown a generally favorable trend over the past five years. The net margin has improved, indicating better profitability, while the ROE and ROIC have remained strong. The P/E and P/B ratios suggest that the market values the company highly, although the current ratio indicates potential liquidity concerns. Overall, the latest year’s ratios are favorable for investors.
Distribution Policy
The Procter & Gamble Company has a strong commitment to returning value to its shareholders through dividends and share buybacks. The payout ratio of 61.80% indicates a balanced approach to distributing profits while retaining sufficient earnings for growth. The annual dividend yield of 2.52% is attractive for income-focused investors. However, the company has engaged in share repurchases, which can be a double-edged sword if not supported by cash flow. Overall, P&G’s distribution policy reflects a commitment to shareholder value.
Sector Analysis
The Procter & Gamble Company operates in the consumer defensive sector, which is characterized by stable demand for essential products. P&G holds a significant market share in various categories, including beauty, grooming, and household products. The competitive landscape is intense, with several key players vying for market share. Technological advancements and changing consumer preferences pose challenges, but P&G’s strong brand portfolio and commitment to innovation provide a competitive edge.
Main Competitors
The following table outlines the main competitors of The Procter & Gamble Company along with their market shares:
Company
Market Share
Unilever
12%
Colgate-Palmolive
10%
Reckitt Benckiser
8%
The Procter & Gamble Company
15%
P&G’s main competitors include Unilever, Colgate-Palmolive, and Reckitt Benckiser, each holding significant market shares in the consumer goods sector. P&G’s strong brand recognition and diverse product offerings help maintain its competitive position.
Competitive Advantages
The Procter & Gamble Company benefits from several competitive advantages, including a strong brand portfolio, extensive distribution networks, and a commitment to innovation. The company’s focus on sustainability and consumer-centric product development positions it well for future growth. P&G’s ability to adapt to changing market dynamics and consumer preferences will be crucial in maintaining its competitive edge.
Stock Analysis
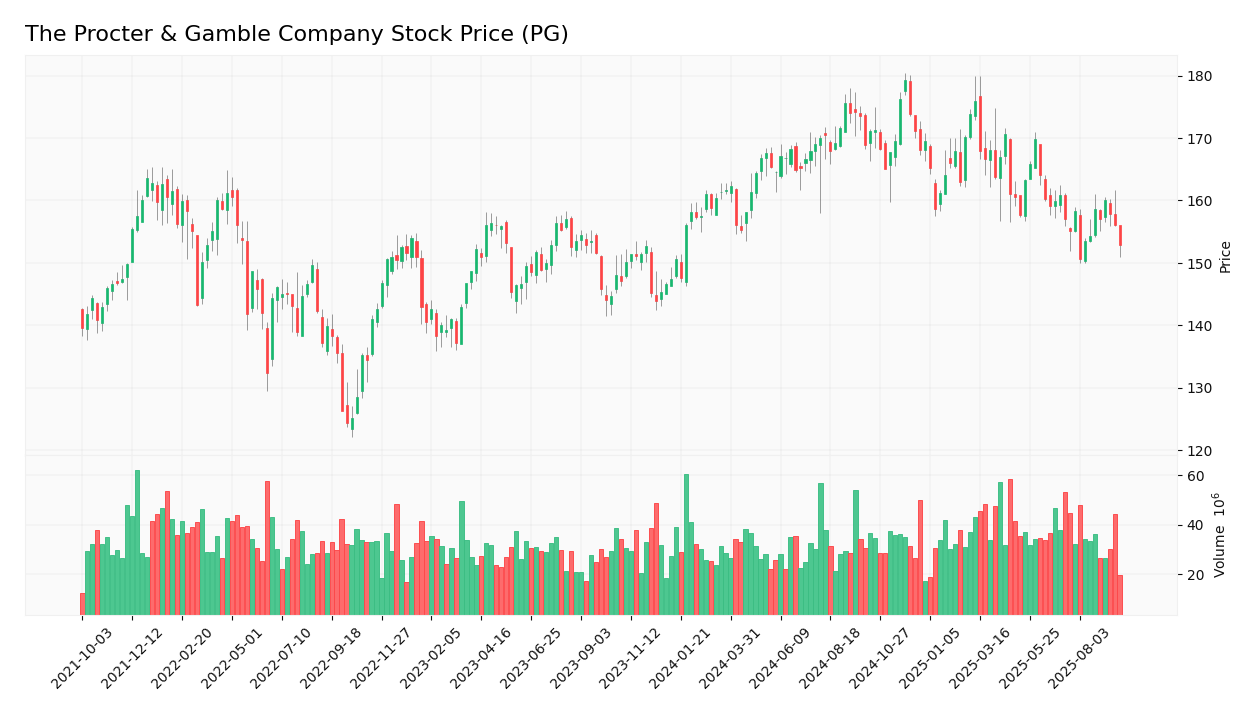
The following chart illustrates The Procter & Gamble Company’s stock price trend over the past year:
Trend Analysis
The Procter & Gamble Company’s stock has experienced fluctuations over the past year, with a current price of $152.89. The stock has a beta of 0.362, indicating lower volatility compared to the market. The average trading volume is approximately 7.9 million shares, suggesting a healthy level of investor interest. Over the past year, the stock has traded within a range of $149.91 to $180.43. The overall trend appears to be stable, with a slight bullish sentiment as the stock price has shown resilience despite market fluctuations.
Volume Analysis
Over the last three months, trading volumes for The Procter & Gamble Company have averaged around 7.9 million shares per day. This consistent volume indicates a balanced market sentiment, with neither buyers nor sellers dominating. The volume trend has remained stable, suggesting that investor interest in the stock is steady, which is a positive sign for potential investors.
Analyst Opinions
Recent analyst recommendations for The Procter & Gamble Company have been predominantly positive, with many analysts rating the stock as a “buy” due to its strong fundamentals and market position. The consensus among analysts is that P&G is well-positioned for long-term growth, making it a favorable investment choice in 2025.
Consumer Opinions
Consumer feedback on The Procter & Gamble Company’s products is generally positive, with many praising the effectiveness and quality of its offerings. However, some consumers have expressed concerns regarding pricing and product availability.
The following table compares three positive reviews with three negative reviews:
Positive Reviews
Negative Reviews
Effective cleaning products that deliver results.
Prices are higher compared to competitors.
Wide range of trusted brands.
Occasional product shortages in stores.
Innovative and eco-friendly product options.
Some products may not meet expectations.
Risk Analysis
The Procter & Gamble Company faces several risks that could impact its performance. The following table summarizes these risks:
Risk Category
Description
Probability
Potential Impact
Recent Example / Fact
Financial
Fluctuations in raw material costs affecting margins.
Changes in regulations affecting product formulations.
Medium
Moderate
N/A
Geopolitical
Trade tensions impacting international operations.
Medium
High
N/A
Technological
Failure to innovate leading to product obsolescence.
Medium
High
N/A
In summary, the most critical risks for investors in The Procter & Gamble Company include supply chain disruptions and intense competition, which could significantly impact the company’s market position and profitability.
Summary
In conclusion, The Procter & Gamble Company has demonstrated strong financial performance, with a solid portfolio of flagship products and a commitment to innovation. The company’s financial ratios indicate a favorable position, while its competitive advantages and market share support its growth potential. However, investors should remain aware of the risks associated with supply chain disruptions and competition.
The following table summarizes the strengths and weaknesses of The Procter & Gamble Company:
Strengths
Weaknesses
Strong brand portfolio and recognition.
High dependency on consumer spending.
Commitment to sustainability and innovation.
Vulnerability to raw material price fluctuations.
Diverse product offerings across multiple segments.
Intense competition in the consumer goods sector.
Should You Buy The Procter & Gamble Company?
Based on the analysis, The Procter & Gamble Company has a net margin greater than zero, a positive long-term trend, and stable buyer volumes. This indicates a favorable signal for long-term investment. Therefore, I recommend considering P&G as a suitable addition to your portfolio for a long-term strategy. However, investors should remain vigilant regarding potential risks that could impact performance.
Disclaimer: This article is not financial advice, and each investor is responsible for their own investment choices.