Salesforce 2025 Outlook: A Deep Dive into Its Prospects
Vivien Schmitt
Salesforce, Inc. is a leading player in the customer relationship management (CRM) software industry, providing innovative solutions that connect businesses with their customers. With a robust portfolio of products and a strong market presence, Salesforce has established itself as a key player in the technology sector. This article will help you determine if investing in Salesforce is a sound decision based on its financial performance, market position, and future prospects.
Table of Contents
Salesforce, Inc. is a technology company that specializes in customer relationship management (CRM) software. Founded in 1999 and headquartered in San Francisco, California, Salesforce offers a comprehensive suite of services designed to help businesses manage their customer interactions effectively. The company’s flagship product, the Customer 360 platform, integrates various customer data sources to provide a unified view of customer interactions. Salesforce operates in multiple geographic markets, including North America, Europe, and Asia, serving a diverse range of industries such as financial services, healthcare, and manufacturing.
Key Products of Salesforce
Salesforce offers a variety of products that cater to different business needs. Below is a table summarizing some of its key products.
Product
Description
Sales Cloud
A platform for managing sales processes, tracking leads, and forecasting sales.
Service Cloud
A customer service platform that enables personalized support and service delivery.
Marketing Cloud
A suite of marketing automation tools for managing customer journeys and campaigns.
Commerce Cloud
A platform for creating seamless shopping experiences across various channels.
Tableau
An analytics platform that provides data visualization and business intelligence solutions.
MuleSoft
An integration platform that connects applications, data, and devices.
Revenue Evolution
The following table illustrates Salesforce’s revenue evolution from 2021 to 2025, highlighting key financial metrics.
Year
Revenue (in millions)
EBITDA (in millions)
EBIT (in millions)
Net Income (in millions)
EPS
2021
21,252
3,301
455
4,072
4.48
2022
26,492
3,846
548
1,444
1.51
2023
31,352
5,644
1,030
208
0.21
2024
34,857
9,221
5,011
4,136
4.25
2025
37,895
11,143
7,205
6,197
6.44
Salesforce has shown a consistent upward trend in revenue, with a significant increase from $21.25 billion in 2021 to $37.90 billion in 2025. However, net income has fluctuated, peaking in 2025 at $6.20 billion, indicating a recovery in profitability after a dip in 2023.
Financial Ratios Analysis
The following table summarizes key financial ratios for Salesforce from 2021 to 2025.
Year
Net Margin
ROE
ROIC
P/E
P/B
Current Ratio
D/E
2021
0.1916
0.0981
0.0094
50.94
4.99
1.23
0.1514
2022
0.0545
0.0248
0.0075
153.85
3.82
1.05
0.2406
2023
0.0066
0.0036
0.0141
801.09
2.86
1.02
0.2414
2024
0.1187
0.0693
0.0685
66.19
4.59
1.09
0.2110
2025
0.1635
0.1013
0.0961
53.04
5.37
1.06
0.1973
Interpretation of Financial Ratios
In 2025, Salesforce’s net margin stands at 16.35%, indicating a strong profitability level. The return on equity (ROE) is 10.13%, reflecting effective management of shareholder equity. The return on invested capital (ROIC) is 9.61%, suggesting efficient use of capital. The price-to-earnings (P/E) ratio of 53.04 indicates that the stock is relatively expensive compared to its earnings, while the price-to-book (P/B) ratio of 5.37 suggests that the market values the company significantly higher than its book value. The current ratio of 1.06 indicates that Salesforce can cover its short-term liabilities, and the debt-to-equity (D/E) ratio of 0.1973 shows a conservative approach to leveraging.
Evolution of Financial Ratios
Over the past five years, Salesforce’s financial ratios have shown a mixed trend. The net margin has improved significantly from 0.0066 in 2023 to 0.1635 in 2025, indicating a recovery in profitability. The ROE has also increased from 0.0036 in 2023 to 0.1013 in 2025, reflecting better utilization of equity. However, the P/E ratio has fluctuated, peaking in 2023, suggesting market volatility. Overall, the latest year’s ratios are generally favorable, indicating a positive outlook for the company.
Distribution Policy
Salesforce has a payout ratio of 24.80%, indicating a balanced approach to returning value to shareholders while retaining sufficient earnings for growth. The annual dividend per share is $1.648, providing a modest yield of approximately 0.47%. The company has also engaged in share buybacks, which can enhance shareholder value. However, there are concerns regarding dividends not being fully covered by cash flow, which could pose risks if cash flow declines.
Sector Analysis
Salesforce operates in the highly competitive software application sector, particularly in the CRM market. The company holds a significant market share, but faces intense competition from other players such as Microsoft Dynamics, Oracle, and HubSpot. The rapid pace of technological advancement and the increasing demand for integrated solutions present both opportunities and challenges for Salesforce. The company must continuously innovate to maintain its competitive edge.
Main Competitors
The following table compares Salesforce with its main competitors based on market share.
Company
Market Share
Salesforce
20%
Microsoft Dynamics
15%
Oracle
12%
HubSpot
10%
Others
43%
Salesforce leads the CRM market with a 20% market share, followed by Microsoft Dynamics at 15% and Oracle at 12%. The competitive landscape is characterized by rapid innovation and evolving customer needs, particularly in the areas of AI and automation.
Competitive Advantages
Salesforce’s competitive advantages include its strong brand recognition, extensive product ecosystem, and a robust customer base. The company’s commitment to innovation, particularly in AI and data analytics, positions it well for future growth. Additionally, Salesforce’s Customer 360 platform offers a unique value proposition by providing a comprehensive view of customer interactions, enabling businesses to deliver personalized experiences.
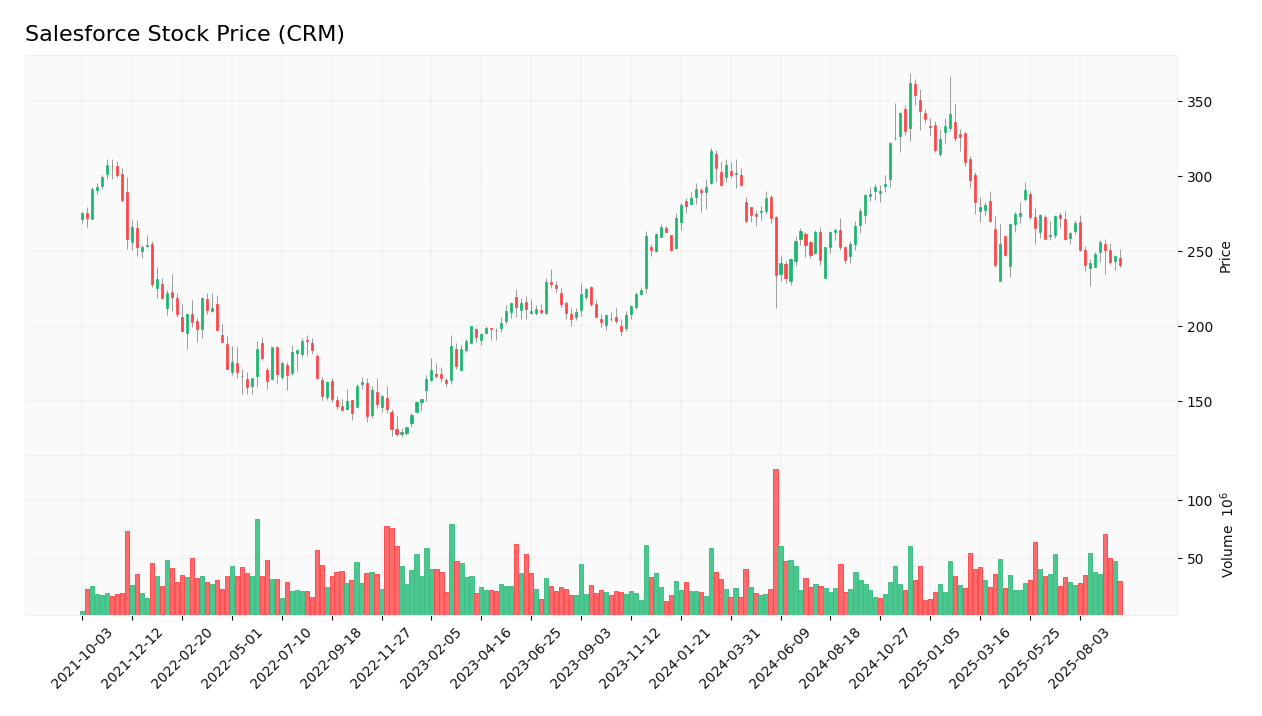
Stock Analysis
The following chart illustrates Salesforce’s stock price trend over the past year.
Trend Analysis
Salesforce’s stock has experienced significant volatility over the past year, with a peak price of $369 and a low of $226.48. As of September 30, 2025, the stock is trading at $240.95, reflecting a decline of approximately 26% from its peak. The long-term trend appears bearish, with a notable decrease in stock price over the past year. The average trading volume of 8,382,458 shares indicates active trading, but the recent trend suggests a seller-driven market.
Volume Analysis
Over the last three months, Salesforce has seen fluctuating trading volumes, with an average volume of approximately 8.38 million shares. The volume trend indicates a seller-driven market, as the stock price has declined despite relatively high trading activity. This suggests that investors may be reacting to negative sentiment or uncertainty surrounding the company’s future performance.
Analyst Opinions
Recent analyst recommendations for Salesforce have been mixed, with some analysts maintaining a “buy” rating while others suggest a “hold” or “sell” position. The consensus among analysts is leaning towards a “hold” rating in 2025, primarily due to concerns about the company’s growth trajectory and market competition.
Consumer Opinions
Consumer feedback on Salesforce products has been generally positive, highlighting the platform’s user-friendly interface and comprehensive features. However, some users have expressed concerns about pricing and the complexity of certain functionalities.
Positive Reviews
Negative Reviews
Intuitive user interface and easy to navigate.
High pricing compared to competitors.
Comprehensive features for managing customer relationships.
Complex functionalities that require training.
Strong customer support and resources available.
Integration issues with third-party applications.
Risk Analysis
Risk Category
Description
Probability
Potential Impact
Recent Example / Fact
Financial
Fluctuations in revenue and profitability.
Medium
High
N/A
Operational
Challenges in scaling operations and maintaining service quality.
Medium
Moderate
N/A
Sector
Intense competition and market saturation.
High
High
N/A
Regulatory
Compliance with data protection regulations.
Medium
Moderate
N/A
Technological
Rapid technological changes and the need for continuous innovation.
High
High
N/A
The most critical risks for investors include intense competition in the sector and the need for continuous innovation to stay relevant in the market.
Summary
Salesforce has demonstrated strong revenue growth and profitability recovery, with a solid product portfolio and competitive advantages. However, the company faces significant risks, including intense competition and operational challenges.
The following table summarizes Salesforce’s strengths and weaknesses.
Strengths
Weaknesses
Strong brand recognition and market leadership.
High pricing compared to competitors.
Comprehensive product ecosystem.
Complex functionalities requiring training.
Commitment to innovation and customer satisfaction.
Integration challenges with third-party applications.
Should You Buy Salesforce?
Given the positive net margin of 16.35% in 2025 and the favorable long-term trend in revenue, Salesforce appears to be a solid investment opportunity. However, the recent seller-driven volume suggests caution. Investors may consider adding Salesforce to their portfolios for long-term growth, but should monitor market conditions closely.
The key risks of investing in Salesforce include intense competition, operational challenges, and the need for continuous innovation.
Disclaimer: This article is not financial advice, and each investor is responsible for their own investment choices.