


In a world where digital connections shape our daily interactions, Meta Platforms, Inc. revolutionizes how we communicate, share, and engage through its innovative suite of applications. From Facebook to WhatsApp, its flagship products seamlessly integrate into the lives of billions, fostering communities and driving conversations. As a trailblazer in the Internet Content & Information sector, Meta’s commitment to quality and cutting-edge technology positions it as a formidable market influence. However, as we analyze its current valuation, the pressing question remains: do Meta’s fundamentals still align with its ambitious growth trajectory?


Table of contents
Company Description
Meta Platforms, Inc. is a leading technology company that specializes in developing products that facilitate global communication and connection. Founded in 2004 and headquartered in Menlo Park, California, Meta operates primarily in the Internet Content & Information industry. Its core activities are divided into two segments: Family of Apps, which includes popular platforms like Facebook, Instagram, Messenger, and WhatsApp; and Reality Labs, focusing on augmented and virtual reality technologies. With a substantial market capitalization exceeding $1.5 trillion, Meta is a dominant player in the digital space, continuously innovating to enhance user engagement and connectivity. The company’s strategic emphasis on building an interconnected ecosystem positions it as a pivotal force in shaping the future of social interaction and digital experiences.
Fundamental Analysis
In this section, I will analyze Meta Platforms, Inc.’s income statement, financial ratios, and dividend payout policy to provide insights into its financial health and investment potential.
Income Statement
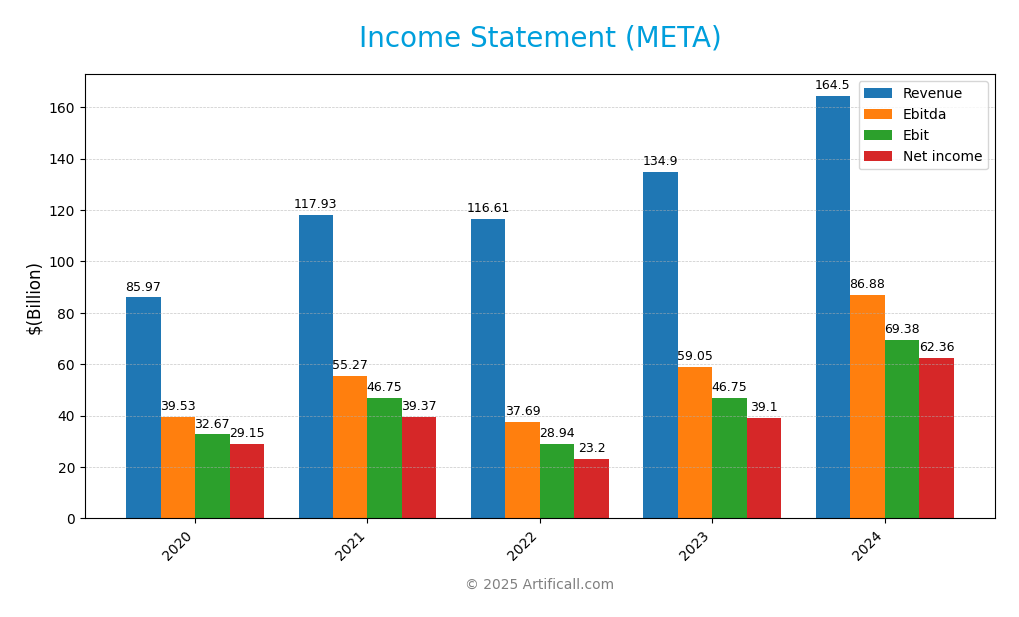
The following table presents the Income Statement for Meta Platforms, Inc. over the past five years, highlighting key financial metrics such as revenue and net income.

| Metric | 2020 | 2021 | 2022 | 2023 | 2024 |
|---|---|---|---|---|---|
| Revenue | 86.0B | 117.9B | 116.6B | 134.9B | 164.5B |
| Cost of Revenue | 16.7B | 22.6B | 25.2B | 25.9B | 30.2B |
| Operating Expenses | 36.6B | 48.5B | 62.4B | 62.2B | 64.9B |
| Gross Profit | 69.3B | 95.3B | 91.4B | 108.9B | 134.3B |
| EBITDA | 39.5B | 55.3B | 37.7B | 59.0B | 86.9B |
| EBIT | 32.7B | 46.8B | 28.9B | 46.8B | 69.4B |
| Interest Expense | 0.0B | 0.0B | 0.2B | 0.4B | 0.7B |
| Net Income | 29.1B | 39.4B | 23.2B | 39.1B | 62.4B |
| EPS | 10.2 | 13.9 | 8.6 | 15.2 | 24.6 |
| Filing Date | 2021-01-28 | 2022-02-03 | 2023-02-02 | 2024-02-02 | 2025-01-30 |
In the most recent year, Meta Platforms, Inc. demonstrated robust growth in both revenue and net income, with revenue increasing by 22% year-over-year to reach $164.5 billion and net income surging to $62.4 billion. The gross profit margin improved slightly from 80.8% in 2023 to 81.6% in 2024, signaling efficient cost management despite rising expenses. While operating expenses saw a marginal increase, the substantial growth in EBITDA indicates that operational performance remains strong. Overall, Meta’s financial performance in 2024 reflects a solid recovery and growth trajectory, though investors should remain vigilant regarding potential market fluctuations.
Financial Ratios
The following table summarizes the financial ratios for Meta Platforms, Inc. (META) over the past five years:
| Ratio | 2020 | 2021 | 2022 | 2023 | 2024 |
|---|---|---|---|---|---|
| Net Margin | 34% | 33% | 20% | 29% | 38% |
| ROE | 23% | 32% | 18% | 26% | 34% |
| ROIC | 23% | 32% | 18% | 24% | 29% |
| P/E | 27 | 24 | 14 | 23 | 24 |
| P/B | 6.07 | 7.58 | 2.57 | 5.95 | 8.12 |
| Current Ratio | 5.05 | 3.15 | 2.20 | 2.67 | 2.98 |
| Quick Ratio | 5.05 | 3.15 | 2.20 | 2.67 | 2.98 |
| D/E | 0.08 | 0.11 | 0.21 | 0.24 | 0.27 |
| Debt-to-Assets | 7% | 10% | 14% | 16% | 18% |
| Interest Coverage | 0 | 2033 | 156 | 105 | 97 |
| Asset Turnover | 0.54 | 0.71 | 0.63 | 0.59 | 0.60 |
| Fixed Asset Turnover | 1.56 | 1.69 | 1.26 | 1.23 | 1.21 |
| Dividend Yield | 0% | 0% | 0% | 0% | 0.34% |
Interpretation of Financial Ratios
In the most recent year, META’s ratios indicate strong financial health. Notably, the net margin improved significantly to 38%, reflecting robust profitability. The return on equity (ROE) at 34% is also impressive, indicating effective management of shareholder equity. However, the interest coverage ratio has decreased, which could raise concerns about the company’s ability to meet interest obligations if this trend continues.
Evolution of Financial Ratios
Over the past five years, META has shown a positive trend in profitability metrics, particularly in net margin and ROE, suggesting improved operational efficiency. However, the rising debt-to-equity ratio warrants attention, as it may indicate increasing leverage that could lead to financial risk if not managed properly.
Distribution Policy
Meta Platforms, Inc. does not currently pay dividends, which is a strategic choice likely aimed at maximizing growth and innovation. The absence of dividend distributions allows the company to reinvest in research and development and pursue acquisitions. Furthermore, Meta engages in share buybacks, reflecting a commitment to returning value to shareholders. This approach aligns with long-term shareholder value creation, provided that the reinvested capital generates sufficient returns in the future.
Sector Analysis
Meta Platforms, Inc. positions itself as a leader in the Internet Content & Information industry, primarily through its innovative Family of Apps and Reality Labs segments, facing competition from various social media and tech giants.
Strategic Positioning
Meta Platforms, Inc. holds a significant market share in the internet content and information industry, driven primarily by its Family of Apps segment, which includes Facebook, Instagram, WhatsApp, and Messenger. With a market capitalization exceeding $1.56 trillion, Meta faces competitive pressure from emerging social media platforms and technological disruptions in virtual and augmented reality. The company’s ability to innovate and adapt to these challenges will be crucial in maintaining its leadership position. As of 2025, I remain cautious about potential regulatory impacts and market volatility, which could affect Meta’s growth trajectory.
Key Products
Meta Platforms, Inc. offers a diverse range of products that facilitate connection and communication across various platforms. Below is an overview of their key products:
| Product | Description |
|---|---|
| A social networking platform that allows users to share updates, photos, and connect with friends and communities. | |
| A photo and video-sharing app that emphasizes visual content and storytelling through posts, stories, and reels. | |
| Messenger | A messaging service that enables text, audio, and video communications across devices, connecting users with friends and businesses. |
| A messaging application that provides secure and private communication for individuals and businesses through text and voice calls. | |
| Oculus Quest | A virtual reality headset that offers immersive experiences in gaming, entertainment, and social interaction. |
| Horizon Worlds | A social platform within the metaverse where users can create, explore, and interact in virtual environments. |
These products reflect Meta’s commitment to fostering connections and engaging users through innovative technology.
Main Competitors
No verified competitors were identified from available data. However, it is important to note that Meta Platforms, Inc. holds a significant market share in the Internet Content & Information sector, particularly through its extensive range of applications such as Facebook, Instagram, and WhatsApp. The company’s competitive position remains strong, primarily in the North American market, where it continues to dominate the social media landscape.
Competitive Advantages
Meta Platforms, Inc. possesses a strong competitive edge through its extensive ecosystem of applications, including Facebook, Instagram, Messenger, and WhatsApp, which collectively facilitate seamless communication and content sharing. The company’s significant investment in augmented and virtual reality through its Reality Labs segment positions it well for future growth, as these technologies are expected to gain traction in various markets. Additionally, Meta’s robust user base and data analytics capabilities present opportunities for monetization and targeted advertising, ensuring its relevance in an increasingly digital world. As new products and innovations emerge, I believe Meta is well-equipped to capitalize on evolving consumer preferences.
SWOT Analysis
This SWOT analysis aims to provide a comprehensive overview of Meta Platforms, Inc. and its strategic positioning in the market.
Strengths
- Strong brand recognition
- Diverse product portfolio
- Large user base
Weaknesses
- Regulatory scrutiny
- Dependence on advertising revenue
- High competition
Opportunities
- Growth in virtual reality market
- Expansion into emerging markets
- Development of new ad products
Threats
- Privacy concerns
- Market volatility
- Technological disruptions
The overall SWOT assessment indicates that while Meta has significant strengths and opportunities, it must address its weaknesses and potential threats to enhance its strategic positioning and sustain growth in a competitive landscape.
Stock Analysis
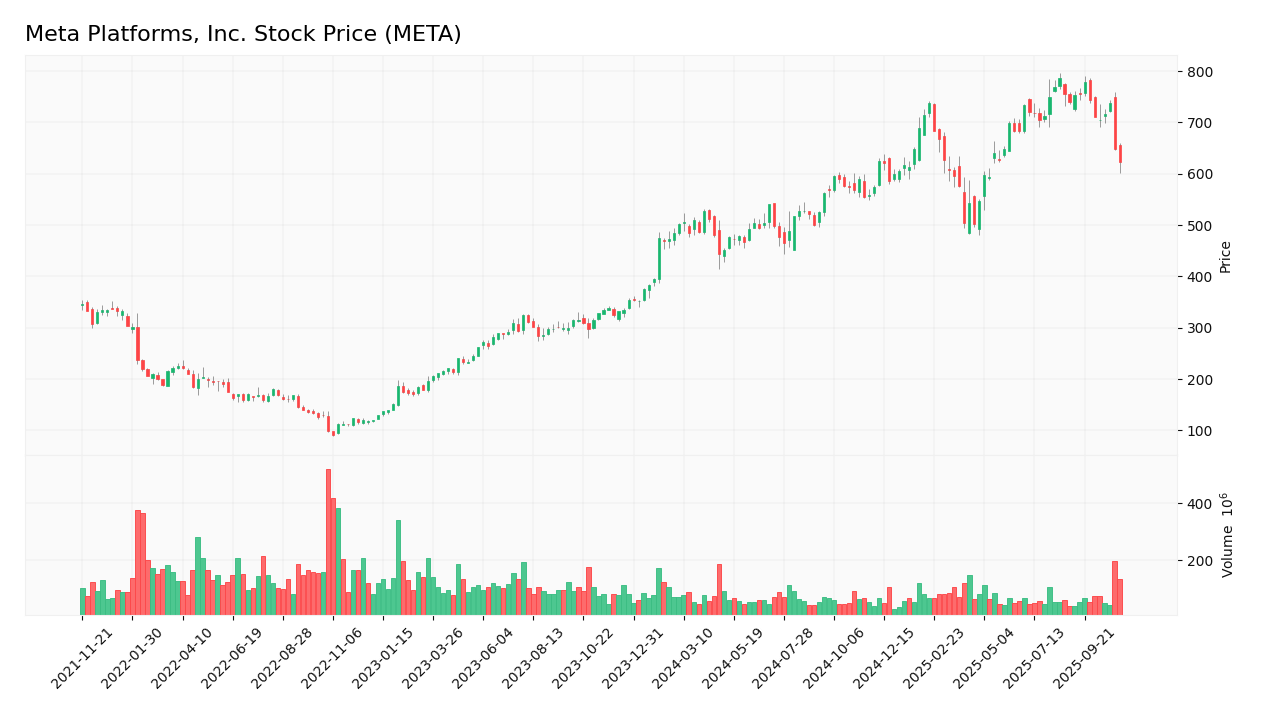
Over the past year, Meta Platforms, Inc. (Ticker: META) has exhibited significant price movements, culminating in an impressive overall price increase of 85.63%. The stock has experienced notable trading dynamics, with key fluctuations that merit close examination.

Trend Analysis
In the analyzed period of the past two years, META’s stock price has increased by 85.63%. This trend is classified as bullish, though it is currently experiencing deceleration. The stock has shown steady upward momentum, with a standard deviation of 110.09 indicating moderate volatility. Throughout this period, the stock reached a high of $785.23 and a low of $334.92, reflecting substantial price swings.
Volume Analysis
Over the last three months, trading volumes have averaged approximately 73.32M, with a buyer-driven activity trend. Despite this, the overall volume is on a bearish trajectory, showing a decreasing trend slope of -94.86K. This suggests that investor sentiment may be leaning towards caution, with market participation less enthusiastic than before. The average buy volume stands at 22.72M, while the average sell volume is considerably higher at 50.61M, indicating seller dominance in the recent trading landscape.
Analyst Opinions
Recent analyst recommendations for Meta Platforms, Inc. (META) present a mixed outlook. On November 7, 2025, analysts rated the stock with a B+ and a neutral recommendation. While the discounted cash flow (DCF) analysis suggests a buy, the return on equity (ROE) and return on assets (ROA) indicate a strong buy. However, concerns regarding debt levels and price-to-earnings (P/E) ratios led to sell ratings in those areas. Overall, the consensus leans towards a hold for the current year, reflecting caution amid varied performance metrics.
Stock Grades
The latest stock ratings for Meta Platforms, Inc. (META) indicate a consistent outlook from various respected grading companies. Below is the summary of the current grades:
| Grading Company | Action | New Grade | Date |
|---|---|---|---|
| Cantor Fitzgerald | maintain | Overweight | 2024-09-30 |
| Monness, Crespi, Hardt | maintain | Buy | 2024-09-30 |
| Rosenblatt | maintain | Buy | 2024-09-26 |
| Wedbush | maintain | Outperform | 2024-09-26 |
| JP Morgan | maintain | Overweight | 2024-09-26 |
| Baird | maintain | Outperform | 2024-09-26 |
| B of A Securities | maintain | Buy | 2024-09-26 |
| JMP Securities | maintain | Market Outperform | 2024-09-26 |
| Cantor Fitzgerald | maintain | Overweight | 2024-09-23 |
| Citigroup | maintain | Buy | 2024-09-23 |
Overall, the trend indicates a strong confidence in META, with multiple firms maintaining their positive grades, emphasizing a stable outlook for investors. The consistency of the grades suggests that analysts see continued growth potential in the company.
Target Prices
The current consensus for Meta Platforms, Inc. indicates a range of target prices from reliable analysts.
| Target High | Target Low | Consensus |
|---|---|---|
| 1117 | 810 | 882.13 |
Overall, analysts expect Meta’s stock to have a significant upside potential, with a consensus target price reflecting cautious optimism.
Consumer Opinions
Consumer sentiment towards Meta Platforms, Inc. reflects a mix of enthusiasm and concern, showcasing the complexities of its market presence.
| Positive Reviews | Negative Reviews |
|---|---|
| “Innovative features keep me engaged!” | “Privacy concerns make me hesitant to use it.” |
| “Great user experience and community building.” | “Ad overload is becoming a real issue.” |
| “Excellent customer support when needed.” | “Algorithm changes often hurt visibility.” |
| “Constant updates improve functionality.” | “Some features feel unnecessary and cluttered.” |
Overall, consumer feedback indicates that while users appreciate Meta’s innovation and community-building efforts, concerns about privacy and ad saturation are significant weaknesses that the company must address.
Risk Analysis
In this section, I present a structured overview of potential risks associated with investing in Meta Platforms, Inc. (META), focusing on their probability and impact.
| Category | Description | Probability | Impact |
|---|---|---|---|
| Regulatory Risks | Increased scrutiny from regulators on data privacy. | High | High |
| Market Competition | Intense competition from other social media platforms. | Medium | High |
| Technological Changes | Rapid changes in technology affecting user engagement. | High | Medium |
| Economic Downturn | Global economic challenges impacting advertising spend. | Medium | High |
| Reputation Risks | Public backlash over data handling practices. | Medium | High |
Among these risks, regulatory scrutiny and market competition are the most pressing, as they can significantly affect Meta’s market position and financial performance.
Should You Buy Meta Platforms, Inc.?
Meta Platforms, Inc. (META) boasts flagship products such as Facebook, Instagram, and WhatsApp, which continue to dominate the social media landscape. With a net margin of 37.91%, a return on invested capital (ROIC) of 28.62%, and a weighted average cost of capital (WACC) of 9.48%, the company’s financials indicate strong profitability and efficient capital utilization. However, recent risks include increasing competition and potential regulatory challenges.
Given that the net margin is significantly positive (37.91%) and the ROIC exceeds the WACC, along with a favorable long-term trend in performance, I find this stock appears favorable for long-term investors. Nevertheless, the recent bearish trend in volume suggests caution; it may be prudent to wait for confirmation of buyer volumes returning before making a significant addition to your portfolio.
Specific risks related to Meta include heightened competition and regulatory scrutiny, which could impact its market position and profitability over time.
Disclaimer: This article is not financial advice. Each investor is responsible for their own investment decisions.
Additional Resources
- Meta confirms $600B capex to build AI infrastructure in US (META:NASDAQ) – Seeking Alpha (Nov 07, 2025)
- Meta To Spend $600 Billion In US On AI, Aims For ‘Personal Superintelligence’ For Everyone – Benzinga (Nov 07, 2025)
- Meta Platforms, Inc. $META Shares Acquired by Wincap Financial LLC – MarketBeat (Nov 08, 2025)
- Meta is earning a fortune on a deluge of fraudulent ads, documents show – Reuters (Nov 06, 2025)
- Meta Platforms: Trust In Zuck (Rating Upgrade) – Seeking Alpha (Nov 04, 2025)
For more information about Meta Platforms, Inc., please visit the official website: investor.fb.com