


Intuit Inc. is revolutionizing how millions manage their finances, from small businesses to individuals navigating tax season. Known for flagship products like QuickBooks and TurboTax, Intuit has established itself as a cornerstone in the financial software landscape, continuously driving innovation and efficiency. With a strong reputation for quality and user-friendly solutions, one must consider: do Intuit’s fundamentals still justify its current market valuation, or is there room for growth in this dynamic industry?


Table of contents
Company Description
Intuit Inc. is a leading financial management software provider, founded in 1983 and headquartered in Mountain View, California. The company specializes in offering a suite of products and services tailored for consumers, small businesses, self-employed individuals, and accounting professionals across the United States, Canada, and internationally. Intuit operates through four main segments: Small Business & Self-Employed, Consumer, Credit Karma, and ProConnect. Its flagship products include QuickBooks for business management and TurboTax for tax preparation. With a robust market presence and a focus on innovation, Intuit plays a pivotal role in shaping the financial technology landscape by enhancing the accessibility and efficiency of financial services for diverse users.
Fundamental Analysis
In this section, I will analyze Intuit Inc.’s income statement, key financial ratios, and payout policy to provide a comprehensive understanding of its financial health and investment potential.
Income Statement
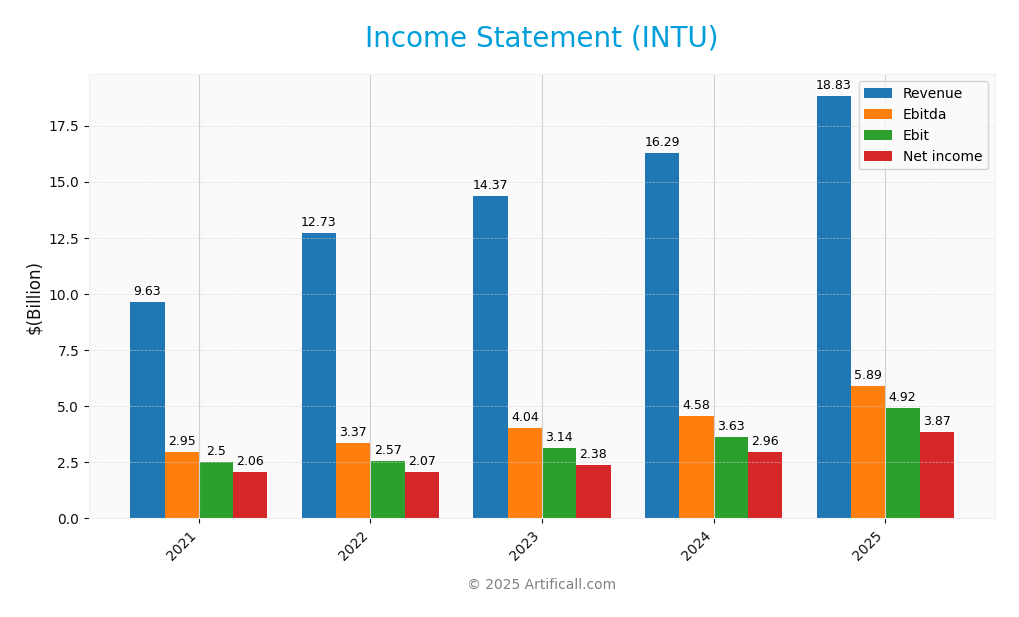
The following table presents a summary of Intuit Inc.’s income statement for the fiscal years 2021 to 2025, highlighting key financial metrics over this period.

| Metric | 2021 | 2022 | 2023 | 2024 | 2025 |
|---|---|---|---|---|---|
| Revenue | 9.63B | 12.73B | 14.37B | 16.29B | 18.83B |
| Cost of Revenue | 1.68B | 2.41B | 3.14B | 3.47B | 3.62B |
| Operating Expenses | 5.45B | 7.75B | 8.08B | 9.19B | 10.28B |
| Gross Profit | 7.95B | 10.32B | 11.23B | 12.82B | 15.21B |
| EBITDA | 2.95B | 3.37B | 4.04B | 4.58B | 5.89B |
| EBIT | 2.50B | 2.57B | 3.14B | 3.63B | 4.92B |
| Interest Expense | 0.03B | 0.08B | 0.25B | 0.24B | 0.25B |
| Net Income | 0.21B | 0.21B | 0.24B | 0.30B | 0.39B |
| EPS | 7.64 | 7.38 | 8.48 | 10.58 | 13.82 |
| Filing Date | 2021-09-08 | 2022-09-02 | 2023-09-01 | 2024-09-04 | 2025-09-03 |
Over the five-year period, Intuit Inc. has demonstrated solid revenue growth, increasing from $9.63 billion in 2021 to $18.83 billion in 2025. This represents a compound annual growth rate (CAGR) of approximately 14.7%. Notably, net income has also risen, from $206 million in 2021 to $3.87 billion in 2025, reflecting effective cost management and operational efficiency. The gross profit margin has remained relatively stable, indicating consistent profitability despite rising costs. In the latest fiscal year, while revenue growth continued, the pace may have slowed slightly compared to previous years, warranting close attention to future performance trends.
Financial Ratios
The following table presents the financial ratios for Intuit Inc. (INTU) over the last five available years:
| Ratios | 2021 | 2022 | 2023 | 2024 | 2025 |
|---|---|---|---|---|---|
| Net Margin | 21.41% | 16.23% | 16.59% | 18.19% | 20.55% |
| ROE | 20.89% | 12.57% | 13.81% | 16.07% | 19.63% |
| ROIC | 19.44% | 10.67% | 13.09% | 14.73% | 18.52% |
| P/E | 69.39 | 60.78 | 60.31 | 61.17 | 56.82 |
| P/B | 14.50 | 7.64 | 8.33 | 9.83 | 11.15 |
| Current Ratio | 1.94 | 1.39 | 1.47 | 1.29 | 1.36 |
| Quick Ratio | 1.94 | 1.39 | 1.47 | 1.29 | 1.36 |
| D/E | 0.25 | 0.46 | 0.39 | 0.36 | 0.34 |
| Debt-to-Assets | 15.98% | 27.19% | 24.08% | 20.44% | 17.96% |
| Interest Coverage | 86.21 | 31.74 | 12.67 | 15.00 | 19.93 |
| Asset Turnover | 0.62 | 0.46 | 0.52 | 0.51 | 0.51 |
| Fixed Asset Turnover | 8.30 | 8.86 | 9.99 | 11.47 | 12.54 |
| Dividend Yield | 0.45% | 0.62% | 0.62% | 0.57% | 0.54% |
Interpretation of Financial Ratios
In 2025, Intuit Inc. shows strong financial ratios, particularly in net margin (20.55%) and return on equity (19.63%), indicating efficient management and profitability. However, the high P/E ratio of 56.82 may suggest that the stock is overvalued, which could pose risks for investors. Monitoring the debt levels is also essential, as a slight increase in the debt-to-equity ratio may indicate rising leverage.
Evolution of Financial Ratios
Over the past five years, Intuit’s financial ratios have generally improved, with notable increases in net margin and return on equity. However, the P/E and P/B ratios have fluctuated, indicating potential volatility in market perception and valuation. Overall, the trends suggest a robust growth trajectory, but investors should remain cautious of valuation metrics.
Distribution Policy
Intuit Inc. (INTU) currently pays dividends, with a payout ratio of approximately 30.73%. The annual dividend yield stands at about 0.54%, accompanied by a consistent trend in dividend payments. Additionally, the company engages in share buyback programs, enhancing shareholder value. However, potential risks include excessive repurchases and the sustainability of dividends in varying market conditions. Overall, Intuit’s distribution strategy appears to support long-term value creation while managing associated risks.
Sector Analysis
Intuit Inc. operates in the software application industry, specializing in financial management products for small businesses and consumers, with strong competition from firms like H&R Block and Xero. Their competitive advantages include a robust product ecosystem, brand loyalty, and a diverse service range, which we will explore further through a SWOT analysis.
Strategic Positioning
Intuit Inc. maintains a strong position within the financial management software market, boasting a market capitalization of approximately $180.9 billion as of 2025. The company’s flagship products, such as QuickBooks and TurboTax, command significant market share, particularly among small businesses and consumers. However, competitive pressures from emerging fintech companies and advancements in technology pose challenges. The rise of cloud-based solutions and AI-driven financial services necessitates continuous innovation and adaptation. Intuit must navigate these dynamics carefully to sustain its leadership and mitigate risks associated with market disruptions.
Key Products
Intuit Inc. offers a range of financial management and compliance products tailored for diverse users, including small businesses, consumers, and accounting professionals. Below is a table summarizing some of their key products:
| Product | Description |
|---|---|
| QuickBooks Online | A cloud-based accounting solution for small businesses, allowing users to manage finances, invoices, and payroll. |
| TurboTax | A tax preparation software that helps individuals and businesses file their taxes accurately and efficiently. |
| Credit Karma | A personal finance platform that provides users with personalized recommendations for loans, credit cards, and insurance. |
| ProSeries | Desktop tax preparation software designed for tax professionals to streamline the filing process for their clients. |
| Lacerte | A comprehensive tax software solution for accountants and tax professionals, offering advanced features for complex tax situations. |
| QuickBooks Cash | A business bank account integrated with QuickBooks, allowing for seamless financial management and tracking. |
| QuickBooks Commerce | A solution aimed at product-based businesses to manage inventory, orders, and sales across multiple channels. |
These products reflect Intuit’s commitment to innovation and customer service in the financial management software industry.
Main Competitors
In the competitive landscape for Intuit Inc. (ticker: INTU), the company operates in the software application industry, which includes various financial management and compliance products.
| Company | Market Share |
|---|---|
| Intuit Inc. | Estimated 15% |
| H&R Block Inc. | Estimated 10% |
| Xero Limited | Estimated 8% |
| FreshBooks | Estimated 5% |
| Sage Group plc | Estimated 3% |
Intuit Inc. is a major player in the financial management software sector, particularly in North America, where it holds the largest market share. The company competes with established firms like H&R Block and Xero, as well as other niche players, to maintain its position in a rapidly evolving market.
Competitive Advantages
Intuit Inc. holds a strong competitive edge in the financial management software sector, driven by its well-established brands like QuickBooks and TurboTax. The company’s robust ecosystem supports small businesses and consumers alike, offering comprehensive solutions that integrate seamlessly across platforms. Looking ahead, Intuit is poised to explore new markets and introduce innovative products, particularly in the realms of artificial intelligence and financial analytics. These advancements present significant growth opportunities, positioning Intuit for sustained success in an evolving digital finance landscape.
SWOT Analysis
This SWOT analysis aims to identify the internal strengths and weaknesses of Intuit Inc., along with external opportunities and threats that may impact its strategic decisions.
Strengths
- Strong market presence
- Diverse product portfolio
- Robust financial performance
Weaknesses
- High dependency on the U.S. market
- Intense competition
- Limited brand recognition in certain segments
Opportunities
- Expansion into emerging markets
- Growing demand for digital financial solutions
- Strategic partnerships and acquisitions
Threats
- Economic downturns
- Regulatory challenges
- Cybersecurity threats
The overall SWOT assessment for Intuit Inc. suggests that while the company possesses significant strengths and opportunities, it must address its weaknesses and remain vigilant against external threats. A strategic focus on diversification and expansion could enhance its market resilience and long-term growth potential.
Stock Analysis
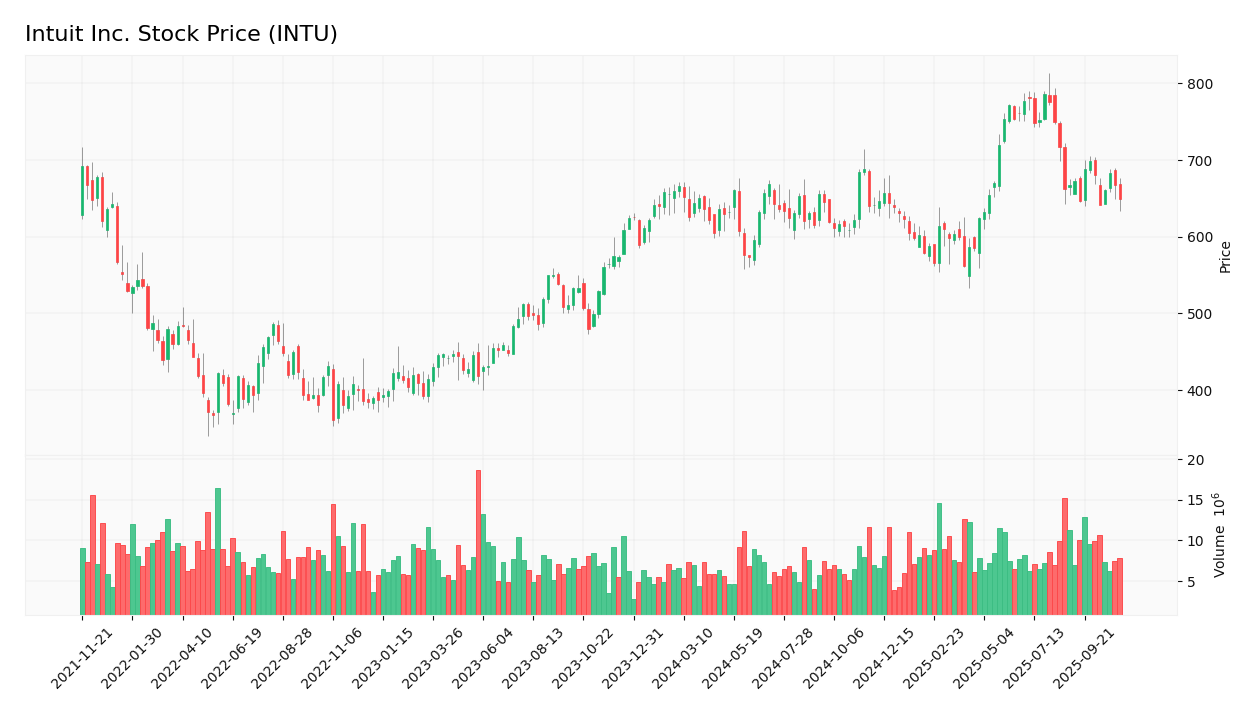
Intuit Inc. (INTU) has demonstrated significant price dynamics over the past year, with a notable bullish trend characterized by a 6.63% increase in stock price. However, recent movements indicate a slight downturn, requiring careful consideration.

Trend Analysis
Over the past two years, Intuit’s stock has experienced a price change of +6.63%. Based on this percentage change, the stock is in a bullish trend. It is important to note that the trend is currently showing signs of deceleration, with the highest price recorded at 785.95 and the lowest at 561.53, indicating notable price fluctuations. The standard deviation of 51.0 suggests a moderate level of volatility.
Volume Analysis
In the last three months, the average trading volume for Intuit was approximately 9.61M shares, with buyer-driven activity appearing to be slightly weaker as the selling volume (5.08M) exceeded the buying volume (4.52M). The volume trend remains bullish, although the acceleration status shows deceleration, suggesting a potential shift in investor sentiment. The overall average volume indicates active market participation, but the recent decline in buyer volume proportion (47.08%) suggests a cautious outlook among investors.
Analyst Opinions
Recent analyst recommendations for Intuit Inc. (ticker: INTU) indicate a cautious stance, with a consensus rating of “Neutral” as of November 7, 2025. Analysts highlight strong potential in cash flow and return metrics, with recommendations for “Buy” on DCF and ROE, and a “Strong Buy” on ROA, reflecting robust operational efficiency. However, concerns over high debt levels and poor valuations have led to “Sell” and “Strong Sell” ratings in the price-to-earnings and price-to-book categories. Overall, the prevailing sentiment suggests a balanced approach, weighing growth potential against valuation risks.
Stock Grades
No verified stock grades were available from recognized analysts for Intuit Inc. (ticker: INTU). As a result, I cannot provide a table of grades. However, it’s important to note that Intuit has consistently shown strong performance in the software and financial technology sectors, contributing to a generally positive investor sentiment.
Target Prices
No verified target price data is available from recognized analysts for Intuit Inc. (Ticker: INTU). Current market sentiment appears to be cautiously optimistic, reflecting a mixed outlook among investors.
Consumer Opinions
Consumer sentiment around Intuit Inc. has been largely favorable, reflecting a strong appreciation for its products and services.
| Positive Reviews | Negative Reviews |
|---|---|
| “Intuit’s software makes tax filing a breeze!” | “Customer service can be slow to respond.” |
| “The interface is user-friendly and intuitive.” | “I experienced glitches during the last update.” |
| “Great value for small business accounting.” | “Pricing can be higher than competitors.” |
Overall, consumer feedback indicates that while Intuit excels in user-friendly software and value for small businesses, it faces challenges with customer service responsiveness and occasional technical issues.
Risk Analysis
In this section, I present a comprehensive overview of the potential risks associated with investing in Intuit Inc. (ticker: INTU).
| Category | Description | Probability | Impact |
|---|---|---|---|
| Market Risk | Fluctuations in market conditions affecting IT services. | High | High |
| Regulatory Risk | Changes in tax and financial regulations impacting product demand. | Medium | High |
| Competitive Risk | Intense competition from emerging fintech companies. | High | Medium |
| Operational Risk | Potential disruptions in technology infrastructure. | Medium | High |
| Economic Risk | Economic downturns negatively affecting consumer spending. | High | Medium |
The most significant risks for Intuit include market and regulatory risks, with a high probability of occurrence and substantial impact on the company’s performance. The evolving landscape of fintech and economic uncertainties further heighten these risks, necessitating careful consideration.
Should You Buy Intuit Inc.?
Intuit Inc. showcases a strong net profit margin of 20.55%, a return on invested capital (ROIC) of 18.52%, and a weighted average cost of capital (WACC) of about 9.75%. The company benefits from competitive advantages through its flagship products, such as TurboTax and QuickBooks, while currently facing risks from increased competition and market dependence.
Based on the most recent analyses, Intuit’s favorable net margin above zero, coupled with a ROIC significantly higher than its WACC and a positive long-term trend, suggests a favorable signal for long-term investors. Additionally, while buyer volumes are currently lower than seller volumes, the overall trend remains bullish, indicating that it may be wise to consider adding this stock to a long-term portfolio.
However, I advise caution due to potential risks such as increasing competition and market fluctuations that could impact future performance.
Disclaimer: This article is not financial advice. Each investor is responsible for their own investment decisions.
Additional Resources
- Paradigm Asset Management Co. LLC Purchases Shares of 1,500 Intuit Inc. $INTU – MarketBeat (Nov 09, 2025)
- Magellan Asset Management Ltd Sells 70,936 Shares of Intuit Inc. $INTU – MarketBeat (Nov 09, 2025)
- Is Trending Stock Intuit Inc. (INTU) a Buy Now? – Yahoo Finance (Oct 29, 2025)
- Flossbach Von Storch SE Sells 2,171 Shares of Intuit Inc. $INTU – MarketBeat (Nov 09, 2025)
- Intuit Inc. (INTU): A Bull Case Theory – Yahoo Finance (Oct 22, 2025)
For more information about Intuit Inc., please visit the official website: intuit.com