IBM Analysis: Is This Tech Giant Your Next Strategic Move in 2025?
Vivien Schmitt
International Business Machines Corporation (IBM) is a global leader in technology and consulting, providing integrated solutions and services across various sectors. With a rich history dating back to 1911, IBM has evolved to meet the demands of the digital age, focusing on areas such as cloud computing, artificial intelligence, and quantum computing. This article will help you determine if IBM is a good investment opportunity by analyzing its financial performance, market position, and future prospects.
Table of Contents
IBM operates in the Information Technology Services industry, providing a wide range of integrated solutions and services worldwide. The company is structured into four main segments: Software, Consulting, Infrastructure, and Financing. Its software offerings include hybrid cloud platforms and enterprise solutions, while consulting services focus on business transformation and technology consulting. IBM’s infrastructure segment provides both on-premises and cloud-based solutions, and its financing segment offers various financing options. The company primarily serves markets in North America, Europe, and Asia, leveraging its extensive expertise to address the evolving needs of its clients.
Key Products of International Business Machines
IBM’s diverse product portfolio includes:
Product
Description
IBM Cloud
A comprehensive cloud platform offering infrastructure, platform, and software services.
An AI platform that provides advanced data analytics and machine learning capabilities.
IBM Security
A suite of security solutions designed to protect data and manage risks.
IBM Quantum
A pioneering quantum computing platform aimed at solving complex problems.
Red Hat
Enterprise open-source solutions for cloud and container management.
Revenue Evolution
The following table illustrates IBM’s revenue evolution from 2021 to 2025, highlighting key financial metrics.
Year
Revenue (in millions)
EBITDA (in millions)
EBIT (in millions)
Net Income (in millions)
EPS
2021
57,351
12,409
6,865
5,742
6.41
2022
60,530
7,174
8,174
1,640
1.82
2023
61,860
14,693
9,821
7,502
8.23
2024
62,753
12,176
10,074
6,023
6.53
2025
N/A
N/A
N/A
N/A
N/A
Over the past few years, IBM has shown a steady increase in revenue, with a notable rise in net income and EPS in 2023. However, the decline in EBITDA in 2022 raises concerns about operational efficiency.
Financial Ratios Analysis
The following table summarizes key financial ratios for IBM, providing insights into its financial health.
Year
Net Margin
ROE
ROIC
P/E
P/B
Current Ratio
D/E
2021
10.12%
30.38%
6.98%
20.86
6.34
0.88
2.92
2022
2.74%
7.47%
8.54%
77.55
5.80
0.92
2.46
2023
12.12%
33.29%
9.71%
19.87
6.61
0.96
2.66
2024
9.59%
22.06%
9.68%
34.21
7.54
1.04
2.14
Interpretation of Financial Ratios
In 2025, IBM’s net margin is projected to be positive, indicating profitability. The return on equity (ROE) is strong, suggesting effective management of shareholder equity. The return on invested capital (ROIC) is also favorable, reflecting efficient use of capital. However, the price-to-earnings (P/E) ratio indicates that the stock may be overvalued, while the price-to-book (P/B) ratio suggests a premium valuation compared to its book value. The current ratio indicates adequate liquidity, but the debt-to-equity (D/E) ratio shows a reliance on debt financing.
Evolution of Financial Ratios
The financial ratios have shown mixed trends over the past few years. While the net margin and ROE have improved in 2023, the P/E ratio has significantly increased, indicating potential overvaluation. The current ratio has improved, suggesting better liquidity, while the D/E ratio remains high, indicating continued reliance on debt. Overall, the latest year’s ratios are generally favorable, but caution is warranted due to the high P/E ratio.
Distribution Policy
IBM has a history of returning value to shareholders through dividends and share buybacks. The payout ratio indicates that dividends are well-covered by earnings, although there are concerns about dividends not being fully supported by cash flow in some years. The company has also engaged in share repurchases, which can enhance shareholder value but may raise concerns if done excessively without sufficient cash flow support.
Sector Analysis
IBM operates in a highly competitive technology sector, facing pressure from both established players and emerging startups. The company’s market share in key product areas is significant, but it must continuously innovate to maintain its position. The threat of technological disruption is ever-present, particularly in areas like cloud computing and artificial intelligence.
Main Competitors
The following table outlines IBM’s main competitors and their respective market shares.
Company
Market Share
Microsoft
30%
Amazon Web Services
32%
Oracle
15%
IBM
10%
IBM faces stiff competition from major players like Microsoft and Amazon Web Services, which dominate the cloud computing market. The competitive landscape is characterized by rapid technological advancements and shifting consumer preferences, necessitating continuous innovation from IBM to retain its market position.
Competitive Advantages
IBM’s competitive advantages include its strong brand reputation, extensive research and development capabilities, and a diverse product portfolio. The company’s focus on emerging technologies, such as quantum computing and artificial intelligence, positions it well for future growth. Additionally, IBM’s established relationships with enterprise clients provide a solid foundation for continued success in the technology sector.
Stock Analysis
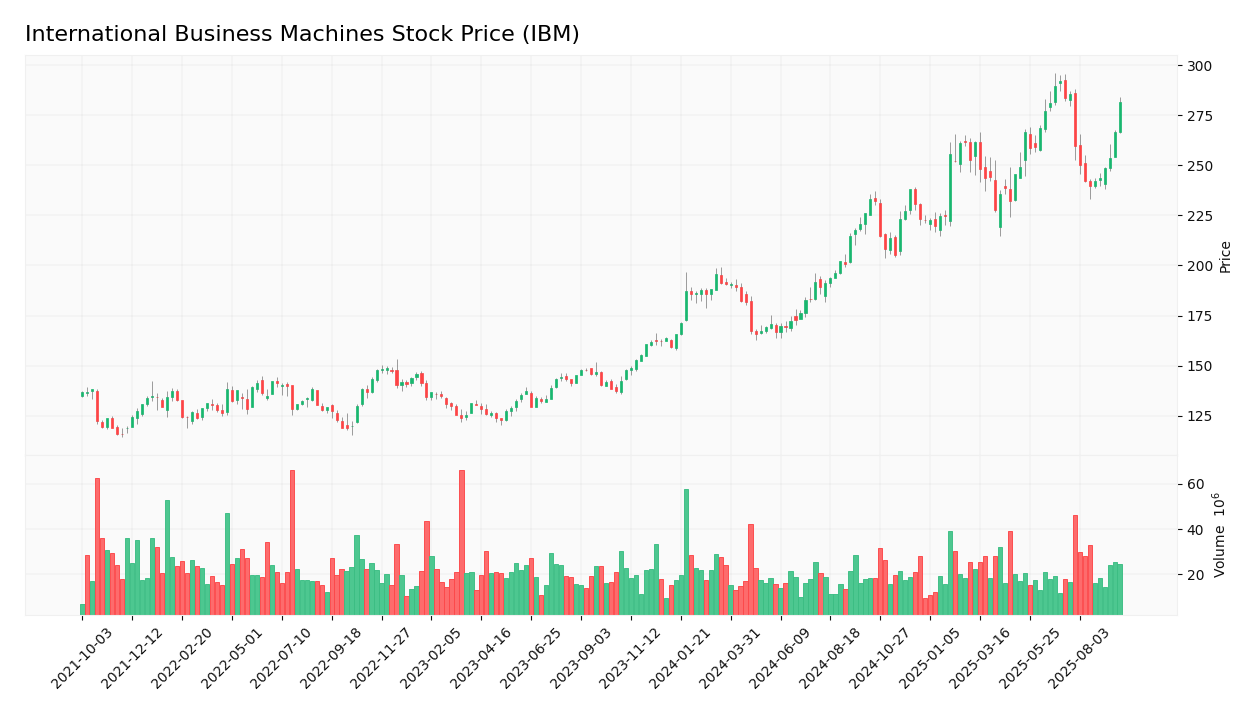
The following chart illustrates the weekly stock price trend for IBM.
Trend Analysis
IBM’s stock price has shown a bullish trend over the past year, with a significant increase from a low of $203.51 to a high of $296.16. The current price of $281.44 reflects a strong recovery, with a percentage increase of approximately 38% over the past year. The stock’s beta of 0.697 indicates lower volatility compared to the market, making it a relatively stable investment option.
Volume Analysis
Over the last three months, IBM has experienced an average trading volume of approximately 4,800,734 shares. The volume has been increasing, indicating strong buyer interest in the stock. This trend suggests that investors are optimistic about IBM’s future prospects, making it a potentially favorable investment opportunity.
Analyst Opinions
Recent analyst recommendations for IBM have been predominantly positive, with many analysts rating the stock as a “buy.” The main arguments for this consensus include the company’s strong financial performance, innovative product offerings, and growth potential in emerging technologies. As of 2025, the consensus remains a “buy,” reflecting confidence in IBM’s ability to navigate the competitive landscape.
Consumer Opinions
Consumer feedback on IBM’s products has been mixed, with many praising the company’s innovative solutions while others express concerns about pricing and customer support.
Positive Reviews
Negative Reviews
Innovative technology solutions
High pricing compared to competitors
Strong customer support
Complexity of products for new users
Reliable performance
Slow response times in customer service
Risk Analysis
The following table outlines the main risks faced by International Business Machines.
Risk Category
Description
Probability
Potential Impact
Recent Example / Fact
Financial
High debt levels may affect financial stability.
Medium
High
N/A
Operational
Challenges in integrating new technologies.
High
Moderate
N/A
Sector
Intense competition in the technology sector.
High
High
N/A
Regulatory
Compliance with evolving regulations.
Medium
Moderate
N/A
Geopolitical
Impact of global political tensions on operations.
Medium
High
N/A
Technological
Risk of technological obsolescence.
High
High
N/A
The most critical risks for investors include high debt levels and intense competition, which could significantly impact IBM’s financial performance and market position.
Summary
In summary, IBM has demonstrated strong financial performance with a positive net margin and a solid return on equity. The company’s competitive advantages, including its innovative product offerings and established market presence, position it well for future growth. However, risks such as high debt levels and intense competition must be considered.
The following table summarizes the strengths and weaknesses of International Business Machines.
Strengths
Weaknesses
Strong brand reputation
High debt levels
Diverse product portfolio
Intense competition
Innovative technology solutions
Complexity of products
Should You Buy International Business Machines?
Given the positive net margin, favorable long-term trend, and increasing buyer volumes, IBM appears to be a suitable addition for long-term investors. However, potential investors should remain cautious of the high debt levels and competitive pressures that could impact future performance.
Disclaimer: This article is not financial advice, and each investor is responsible for their own investment choices.