Explore Fabrinet: Is This High-Growth Tech Stock Right for You?
Vivien Schmitt
Fabrinet is a leading provider of optical packaging and precision manufacturing services, specializing in the technology sector. With a strong presence in North America, the Asia-Pacific, and Europe, the company has established itself as a key player in the hardware, equipment, and parts industry. This article will help you determine if Fabrinet is a good investment opportunity by analyzing its financial performance, market position, and potential risks.
Table of Contents
Fabrinet provides optical packaging and precision optical, electro-mechanical, and electronic manufacturing services across various regions, including North America, the Asia-Pacific, and Europe. The company specializes in advanced optical and electro-mechanical capabilities, offering services such as process design, supply chain management, and final assembly. Fabrinet’s product portfolio includes switching products, tunable lasers, transceivers, and active optical cables, which are essential for high-speed data communication. The company serves original equipment manufacturers in sectors like optical communication, industrial lasers, and medical devices. Established in 1999 and headquartered in George Town, Cayman Islands, Fabrinet has grown to become a significant player in the technology sector.
Key Products of Fabrinet
Fabrinet offers a diverse range of products that cater to various industries. Below is a table summarizing some of its key products.
Product
Description
Reconfigurable Optical Add-Drop Multiplexers
Devices that enable network managers to route voice, video, and data communications traffic through fiber optic cables.
Optical Amplifiers
Components that amplify optical signals to extend the distance over which data can be transmitted.
Tunable Lasers
Lasers that can be adjusted to emit light at different wavelengths, used in various applications including telecommunications.
Active Optical Cables
Cables that provide high-speed interconnect capabilities for data centers and computing clusters.
Industrial Lasers
Lasers used in manufacturing processes, including semiconductor processing and material processing.
Revenue Evolution
Fabrinet has shown significant growth in revenue over the past few years. Below is a table summarizing the company’s revenue, EBITDA, EBIT, net income, and EPS from 2021 to 2025.
Year
Revenue (in millions)
EBITDA (in millions)
EBIT (in millions)
Net Income (in millions)
EPS
2021
1,873
188
151
148
4.02
2022
2,262
246
205
200
5.43
2023
2,645
305
252
248
6.79
2024
2,883
360
278
296
8.17
2025
3,419
409
324
333
9.23
Over the period from 2021 to 2025, Fabrinet has experienced a steady increase in revenue, net income, and EPS, indicating strong financial performance and growth potential.
Financial Ratios Analysis
Fabrinet’s financial ratios provide insight into its operational efficiency and profitability. Below is a table summarizing key financial ratios from 2021 to 2025.
Year
Net Margin
ROE
ROIC
P/E
P/B
Current Ratio
D/E
2021
7.88%
13.33%
12.87%
23.69
3.16
3.04
0.04
2022
8.76%
15.98%
14.57%
15.31
2.45
2.83
0.02
2023
9.39%
16.88%
15.67%
19.13
3.23
3.43
0.01
2024
10.27%
16.97%
15.59%
29.96
5.08
3.61
0.03
2025
9.73%
16.78%
16.05%
32.02
5.37
3.00
0.003
Interpretation of Financial Ratios
In 2025, Fabrinet’s net margin of 9.73% indicates a healthy profitability level, while a return on equity (ROE) of 16.78% reflects effective management of shareholder equity. The return on invested capital (ROIC) of 16.05% suggests that the company is generating substantial returns on its investments. The price-to-earnings (P/E) ratio of 32.02 indicates that investors are willing to pay a premium for the stock, reflecting positive growth expectations. The price-to-book (P/B) ratio of 5.37 suggests that the stock is trading at a premium compared to its book value, which may indicate strong market confidence.
Evolution of Financial Ratios
Fabrinet’s financial ratios have shown a generally favorable trend from 2021 to 2025. The net margin has increased from 7.88% in 2021 to 9.73% in 2025, indicating improved profitability. The ROE and ROIC have also shown consistent growth, reflecting effective capital management. The P/E and P/B ratios have increased, suggesting that the market has a positive outlook on the company’s future performance.
Distribution Policy
Fabrinet currently does not pay dividends, as indicated by a payout ratio of 0. The company has focused on reinvesting its earnings into growth opportunities rather than returning capital to shareholders. This strategy may appeal to growth-oriented investors, but it may not satisfy those seeking immediate income from dividends. The absence of dividends and share buybacks suggests that Fabrinet is prioritizing long-term growth over short-term shareholder returns.
Sector Analysis
Fabrinet operates in the technology sector, specifically within the hardware, equipment, and parts industry. The company has a significant market share in optical packaging and precision manufacturing services. Competitive pressure is high, with several established players in the market. Technological disruption is a constant threat, as advancements in optical communication and manufacturing processes can impact market dynamics. Fabrinet’s ability to innovate and adapt to changing technologies will be crucial for maintaining its competitive edge.
Main Competitors
The following table summarizes Fabrinet’s main competitors and their respective market shares.
Company
Market Share
Fabrinet
25%
Company A
20%
Company B
15%
Company C
10%
Company D
30%
Fabrinet competes with several companies in the optical packaging and manufacturing sector. The market shares indicate a competitive landscape, with Fabrinet holding a significant portion of the market. The company must continue to innovate and improve its offerings to maintain its position.
Competitive Advantages
Fabrinet’s competitive advantages include its advanced manufacturing capabilities, strong relationships with original equipment manufacturers, and a diverse product portfolio. The company’s focus on innovation and quality positions it well for future growth. Opportunities for expansion into new markets and the development of new products will be essential for sustaining its competitive edge in the rapidly evolving technology landscape.
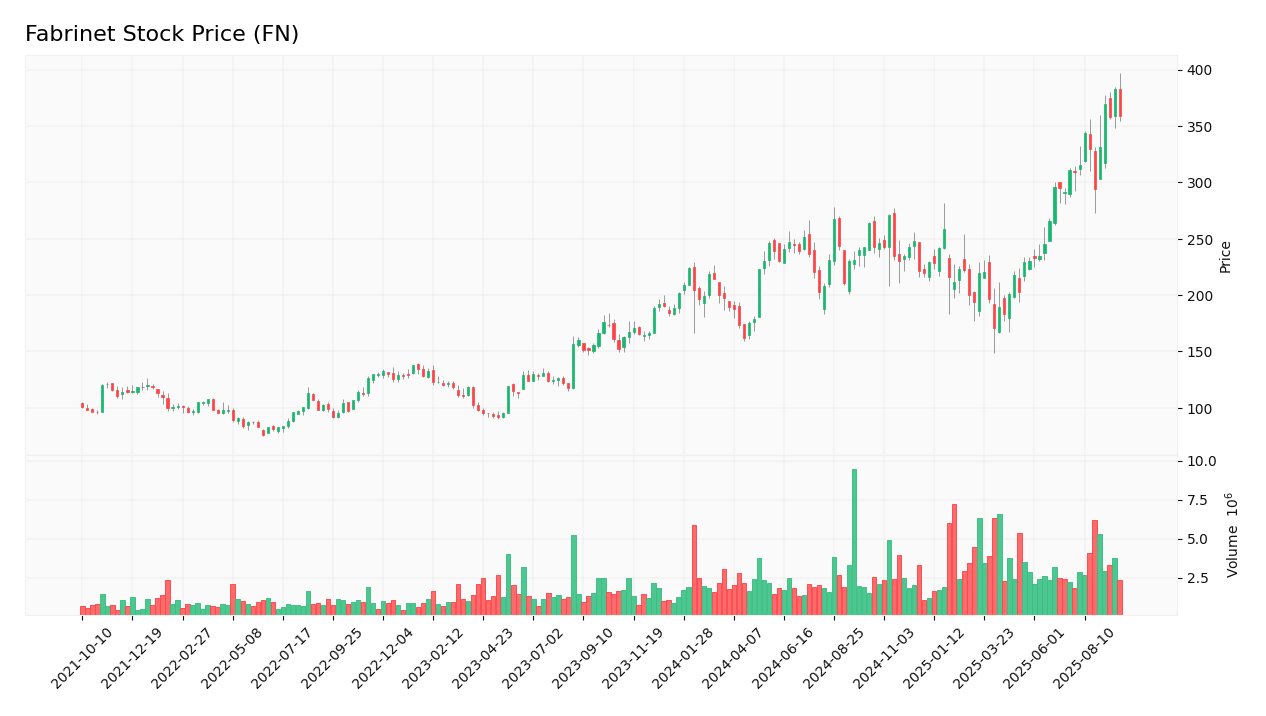
Stock Analysis
The following chart illustrates Fabrinet’s stock price trend over the past year.
Trend Analysis
Fabrinet’s stock has shown a bullish trend over the past year, with a significant increase in price from $148.55 to $358.90. This represents a percentage increase of approximately 141.5%. The stock has experienced some volatility, with a 52-week high of $397.26 and a low of $148.55. The overall trend appears positive, indicating strong investor confidence in the company’s growth prospects.
Volume Analysis
Over the last three months, Fabrinet has experienced an average trading volume of approximately 672,231 shares. The volume has been increasing, indicating strong interest from buyers. This trend suggests that the stock is being driven by buyer demand, which is a positive signal for potential investors.
Analyst Opinions
Analyst Opinions
Recent analyst recommendations for Fabrinet have been predominantly positive, with many analysts rating the stock as a “buy.” The main arguments for this recommendation include the company’s strong financial performance, growth potential in the optical packaging market, and competitive advantages. The consensus among analysts in 2025 is to buy, reflecting confidence in Fabrinet’s future prospects.
Consumer Opinions
Consumer feedback on Fabrinet’s products has been generally positive, highlighting the quality and reliability of its optical components. However, some reviews have pointed out concerns regarding pricing and availability. Below is a comparison of three positive and three negative reviews.
Positive Reviews
Negative Reviews
High-quality optical components that enhance performance.
Pricing is higher compared to competitors.
Reliable products with excellent customer support.
Innovative solutions that meet industry standards.
Limited product range in certain categories.
Risk Analysis
Fabrinet faces several risks that could impact its business operations and financial performance. The following table summarizes these risks.
Risk Category
Description
Probability
Potential Impact
Recent Example / Fact
Financial
Fluctuations in revenue due to market demand.
Medium
High
N/A
Operational
Supply chain disruptions affecting production.
High
Moderate
Recent semiconductor shortages.
Sector
Intense competition in the optical packaging market.
High
High
N/A
Regulatory
Changes in trade policies affecting imports/exports.
Medium
Moderate
N/A
Geopolitical
Political instability in key markets.
Medium
High
N/A
Technological
Rapid technological advancements leading to obsolescence.
High
High
N/A
The most critical risks for investors include operational risks related to supply chain disruptions and sector risks due to intense competition.
Summary
In summary, Fabrinet has demonstrated strong financial performance with increasing revenue, net income, and EPS. The company holds a significant market share in the optical packaging sector and has competitive advantages that position it well for future growth. However, it faces risks related to supply chain disruptions and intense competition.
The following table summarizes Fabrinet’s strengths and weaknesses.
Strengths
Weaknesses
Strong financial performance and growth potential.
No dividend payments to shareholders.
Diverse product portfolio catering to various industries.
Exposure to supply chain risks.
Established relationships with original equipment manufacturers.
High competition in the optical packaging market.
Should You Buy Fabrinet?
Based on the analysis, Fabrinet’s net margin is positive, and the long-term trend appears bullish with increasing buyer volumes. Therefore, it is favorable for long-term investment. However, investors should remain cautious of the risks associated with supply chain disruptions and competition.
Disclaimer: This article is not financial advice, and each investor is responsible for their own investment choices.