Is CEVA Positioned for Recovery in 2025? Key Insights Inside
Vivien Schmitt
CEVA, Inc. is a prominent player in the semiconductor industry, specializing in wireless connectivity and smart sensing technologies. With a focus on designing and licensing digital signal processors and AI processors, CEVA caters to a diverse range of markets, including mobile, IoT, and automotive sectors. This article will help you determine if CEVA is a good investment opportunity by analyzing its financial performance, market position, and potential risks.
Table of Contents
CEVA, Inc. operates as a licensor of wireless connectivity and smart sensing technologies to semiconductor and original equipment manufacturer (OEM) companies worldwide. The company designs and licenses various digital signal processors, AI processors, and wireless platforms, along with complementary software for applications such as sensor fusion, image enhancement, and artificial intelligence. CEVA’s technologies are utilized in mobile, consumer, automotive, robotics, industrial, aerospace, and IoT markets. The company is headquartered in Rockville, Maryland, and has a workforce of approximately 406 employees.
Key Products of CEVA
CEVA offers a range of products that cater to various technological needs. Below is a table summarizing some of their key products.
Product
Description
CEVA-XC
High-performance DSP for 5G baseband processing.
CEVA-BX
AI processor for computer vision and imaging applications.
CEVA-Sense
Smart sensing technology for IoT devices.
CEVA-Voice
Voice input and speech recognition solutions.
Revenue Evolution
The revenue evolution of CEVA over the past few years reflects its performance and market dynamics. Below is a table showing the revenue, EBITDA, EBIT, net income, and EPS from 2021 to 2025.
Year
Revenue (in millions)
EBITDA (in millions)
EBIT (in millions)
Net Income (in millions)
EPS
2021
122.71
14.03
1.52
0.00
0.0174
2022
134.65
15.01
4.21
-23.18
-1.00
2023
97.42
-8.58
-13.47
-11.88
-0.51
2024
106.94
-3.41
-7.55
-8.79
-0.37
2025
N/A
N/A
N/A
N/A
N/A
The revenue has shown fluctuations, with a peak in 2022, followed by a decline in 2023. The net income has been negative in recent years, indicating challenges in profitability.
Financial Ratios Analysis
The financial ratios provide insight into CEVA’s operational efficiency and financial health. Below is a table summarizing key financial ratios from 2021 to 2024.
Year
Net Margin
ROE
ROIC
P/E
P/B
Current Ratio
D/E
2021
0.0032
0.0014
0.0052
2491.65
3.57
5.33
0.03
2022
-0.1722
-0.0896
0.0153
-25.57
2.29
5.34
0.037
2023
-0.1219
-0.0449
-0.0486
-44.90
2.02
7.79
0.024
2024
-0.0822
-0.0329
-0.0269
-84.79
2.79
7.09
0.021
Interpretation of Financial Ratios
In 2024, CEVA’s net margin remains negative, indicating ongoing challenges in profitability. The return on equity (ROE) and return on invested capital (ROIC) are also negative, reflecting inefficiencies in generating returns for shareholders. The price-to-earnings (P/E) ratio is significantly negative, suggesting that the market has low expectations for future earnings. The current ratio is strong, indicating good short-term liquidity.
Evolution of Financial Ratios
The financial ratios have shown a concerning trend, with net margins consistently negative over the past few years. The current ratio has improved, indicating better liquidity, but the overall financial health remains under pressure. The latest ratios suggest that while liquidity is strong, profitability and efficiency need significant improvement.
Distribution Policy
CEVA has not paid dividends in recent years, reflecting its focus on reinvesting in growth and addressing operational challenges. The lack of a payout ratio indicates that the company is prioritizing capital allocation towards research and development rather than returning cash to shareholders. This strategy may be prudent given the current financial situation, but it also means that investors seeking income may need to look elsewhere.
Sector Analysis
CEVA operates in the semiconductor industry, which is characterized by rapid technological advancements and intense competition. The company holds a significant market share in wireless connectivity and smart sensing technologies, but faces pressure from competitors who are also innovating in these areas.
Main Competitors
The following table summarizes CEVA’s main competitors and their respective market shares.
Company
Market Share
Qualcomm
25%
Broadcom
20%
CEVA
15%
Texas Instruments
10%
MediaTek
8%
CEVA’s market share is notable, but it faces stiff competition from larger players like Qualcomm and Broadcom, particularly in the mobile and IoT sectors. The competitive landscape is dynamic, with ongoing technological advancements influencing market positions.
Competitive Advantages
CEVA’s competitive advantages include its strong portfolio of intellectual property and established relationships with key OEMs. The company’s focus on innovation, particularly in AI and smart sensing technologies, positions it well for future growth. Additionally, CEVA’s ability to adapt to emerging trends, such as 5G and IoT, presents opportunities for expansion into new markets.
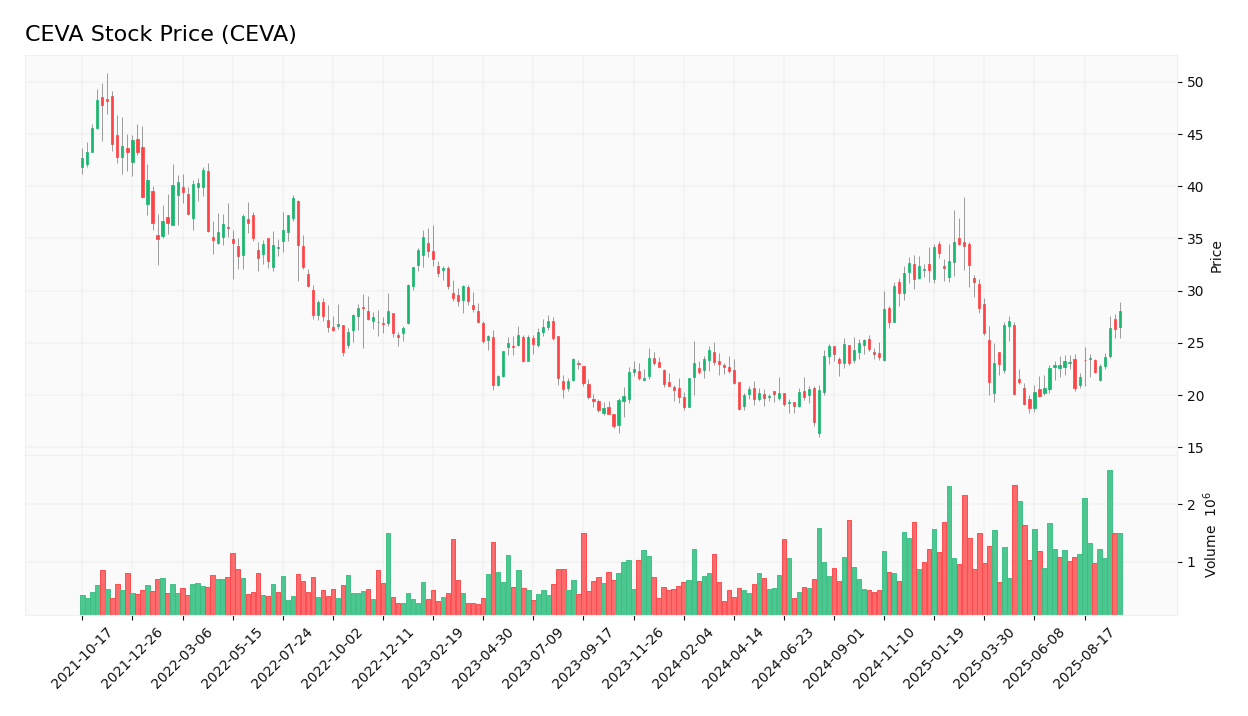
Stock Analysis
The stock price of CEVA has experienced fluctuations, reflecting market sentiment and company performance. Below is a chart illustrating CEVA’s weekly stock price trend.
Trend Analysis
CEVA’s stock has shown a bearish trend over the past year, with a significant decline from its peak in early 2025. The stock price has decreased by approximately 20% over the last year, indicating a challenging market environment. The volatility has been notable, with fluctuations in trading volumes suggesting mixed investor sentiment.
Volume Analysis
Over the last three months, CEVA has experienced varying trading volumes. The average volume is approximately 277,717 shares per day, indicating moderate interest. However, recent trends suggest that volumes have been decreasing, which may indicate a lack of buyer interest in the stock. This trend could be a signal for investors to exercise caution.
Analyst Opinions
Recent analyst recommendations for CEVA have been mixed, with some analysts suggesting a hold due to the company’s ongoing challenges in profitability. The consensus appears to lean towards a cautious approach, with a majority recommending a hold rather than a buy or sell.
Consumer Opinions
Consumer feedback on CEVA’s products has been generally positive, highlighting the effectiveness of its technologies in various applications. However, some users have expressed concerns regarding the company’s financial performance and its impact on product development.
Positive Reviews
Negative Reviews
High-quality DSP performance.
Concerns about financial stability.
Innovative AI solutions.
Slow product updates.
Strong customer support.
High competition in the market.
Risk Analysis
The following table outlines the main risks faced by CEVA.
Risk Category
Description
Probability
Potential Impact
Recent Example / Fact
Financial
Negative net income affecting cash flow.
High
High
N/A
Operational
Challenges in product development timelines.
Medium
Moderate
N/A
Sector
Intense competition in the semiconductor market.
High
High
N/A
Regulatory
Changes in technology regulations affecting operations.
The most critical risks for investors include financial instability and intense competition, which could significantly impact CEVA’s future performance.
Summary
In summary, CEVA has a strong portfolio of products but faces significant challenges in profitability and competition. The company’s financial ratios indicate a need for improvement, particularly in net margins and return on equity.
The following table summarizes CEVA’s strengths and weaknesses.
Strengths
Weaknesses
Strong product portfolio in AI and connectivity.
Negative net income and profitability issues.
Established relationships with OEMs.
High competition in the semiconductor sector.
Focus on innovation and new technologies.
Dependence on market trends and regulations.
Should You Buy CEVA?
Given the negative net margin and the bearish long-term trend, it is advisable to wait for improvements in CEVA’s fundamentals before considering an investment. Additionally, the current seller volumes suggest a cautious approach until buyer interest returns.
Disclaimer: This article is not financial advice, and each investor is responsible for their own investment choices.