Unleash Your Investment Potential: Dive into Cadence Design Systems 2025 Analysis
Vivien Schmitt
Cadence Design Systems, Inc. is a leading player in the software application industry, specializing in electronic design automation (EDA) tools. With a robust portfolio of products and services, Cadence supports various sectors, including 5G communications, aerospace, automotive, and healthcare. This article will help you determine if investing in Cadence Design Systems is a sound opportunity based on its financial performance, market position, and future prospects.
Table of Contents
Cadence Design Systems, Inc. provides software, hardware, services, and reusable integrated circuit (IC) design blocks worldwide. The company offers functional verification services, including emulation and prototyping hardware. Its functional verification offering consists of JasperGold, a formal verification platform; Xcelium, a parallel logic simulation platform; Palladium, an enterprise emulation platform; and Protium, a prototyping platform for chip verification. The company also provides digital IC design and sign-off products, including Genus logic synthesis and Joules RTL power solutions, as well as Modus software solutions to reduce systems-on-chip design-for-test time. Cadence serves various markets, including 5G communications, aerospace and defense, automotive, industrial and healthcare, mobile, consumer, and hyperscale computing.
Key Products of Cadence Design Systems
Cadence Design Systems offers a range of innovative products that cater to the needs of its diverse clientele.
Product
Description
JasperGold
A formal verification platform for ensuring design correctness.
Xcelium
A parallel logic simulation platform for faster verification.
Palladium
An enterprise emulation platform for high-performance verification.
Protium
A prototyping platform for chip verification.
Genus
A logic synthesis tool for digital IC design.
Joules
RTL power solutions for optimizing power consumption.
Revenue Evolution
The following table illustrates the revenue evolution of Cadence Design Systems from 2021 to 2025.
Year
Revenue (in millions)
EBITDA (in millions)
EBIT (in millions)
Net Income (in millions)
EPS
2021
2,988
916
779
696
2.54
2022
3,562
1,203
1,073
849
3.13
2023
4,090
1,464
1,251
1,041
3.86
2024
4,641
1,667
1,351
1,055
3.89
2025
N/A
N/A
N/A
N/A
N/A
The revenue has shown a consistent upward trend, increasing from $2.99 billion in 2021 to an estimated $4.64 billion in 2024. Net income has also improved significantly, reflecting the company’s strong operational efficiency and market demand for its products.
Financial Ratios Analysis
The following table summarizes key financial ratios for Cadence Design Systems over the past few years.
Year
Net Margin
ROE
ROIC
P/E
P/B
Current Ratio
D/E
2021
23.29%
25.39%
20.47%
63.23
18.60
1.77
0.17
2022
23.84%
30.93%
28.33%
51.32
15.87
1.27
0.32
2023
25.46%
30.58%
30.68%
70.47
21.55
1.24
0.22
2024
22.73%
22.58%
17.76%
77.20
17.44
2.93
0.55
Interpretation of Financial Ratios
In 2024, Cadence Design Systems is expected to maintain a net margin of 22.73%, indicating strong profitability. The return on equity (ROE) is projected at 22.58%, reflecting effective management of shareholder equity. The return on invested capital (ROIC) is estimated at 17.76%, suggesting efficient use of capital. The price-to-earnings (P/E) ratio of 77.20 indicates that the stock is relatively expensive compared to its earnings, while the price-to-book (P/B) ratio of 17.44 suggests a high valuation relative to its book value. The current ratio of 2.93 indicates strong liquidity, while the debt-to-equity (D/E) ratio of 0.55 shows a moderate level of debt.
Evolution of Financial Ratios
The financial ratios of Cadence Design Systems have shown a generally favorable trend over the past few years. The net margin has remained above 20%, indicating strong profitability. The ROE and ROIC have also been consistently high, reflecting effective management and capital utilization. The current ratio has improved significantly, suggesting enhanced liquidity. Overall, the latest year’s ratios are favorable for investors.
Distribution Policy
Cadence Design Systems currently does not pay dividends, as indicated by a payout ratio of 0. The company has focused on reinvesting its earnings into growth opportunities, including share buybacks and acquisitions. This strategy may enhance shareholder value in the long term, but it also means that investors seeking immediate income may need to look elsewhere.
Sector Analysis
Cadence Design Systems operates in the highly competitive software application sector, particularly in electronic design automation (EDA). The company holds a significant market share in its key product categories, but it faces competitive pressure from other established players in the industry. Technological disruptions, such as advancements in AI and machine learning, are also reshaping the landscape, presenting both challenges and opportunities for Cadence.
Main Competitors
The following table outlines Cadence Design Systems’ main competitors and their respective market shares.
Company
Market Share
Cadence Design Systems
25%
Synopsys
30%
Mentor Graphics
20%
ANSYS
15%
Others
10%
Cadence competes primarily with Synopsys and Mentor Graphics, which dominate the EDA market. The competition is particularly fierce in North America and Europe, where technological advancements are rapidly evolving.
Competitive Advantages
Cadence Design Systems benefits from several competitive advantages, including a strong brand reputation, a comprehensive product portfolio, and a commitment to innovation. The company’s focus on AI-driven solutions positions it well for future growth, as it can leverage emerging technologies to enhance its offerings. Additionally, Cadence’s extensive customer base across various industries provides a stable revenue stream and opportunities for cross-selling.
Stock Analysis
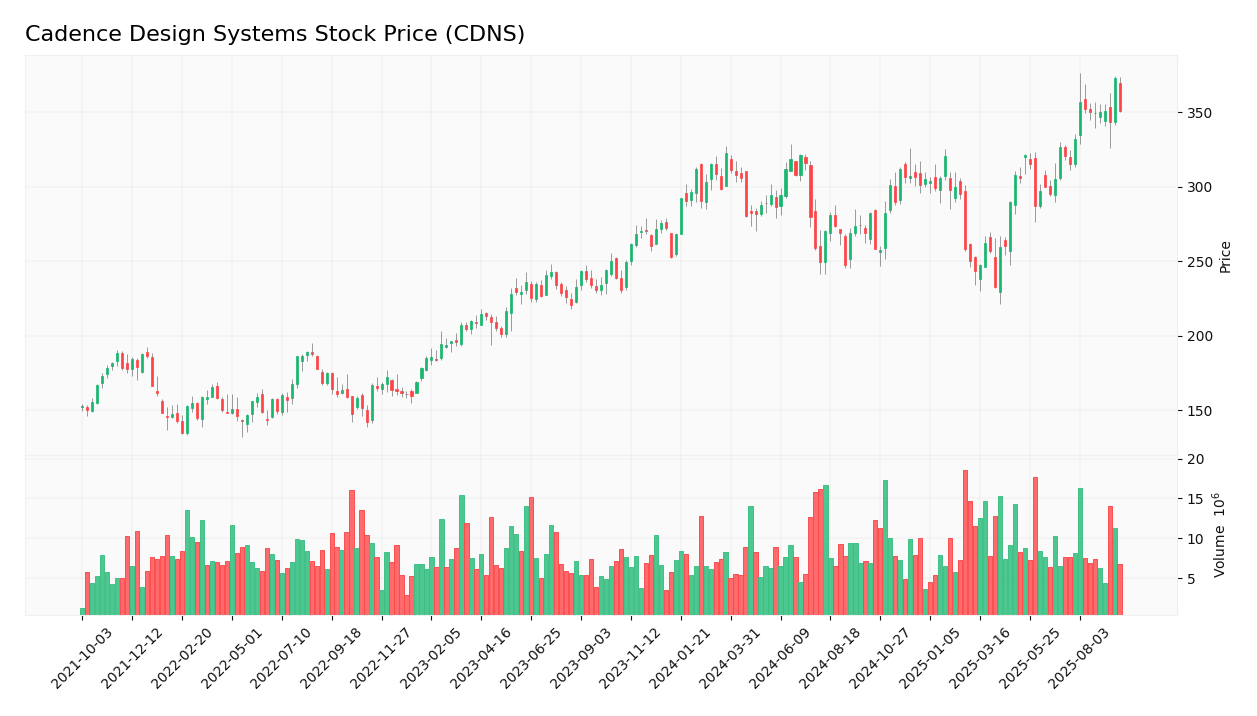
The following chart illustrates the weekly stock price trend of Cadence Design Systems.
Trend Analysis
Cadence Design Systems’ stock has experienced a bullish trend over the past year, with a significant increase in price from $221.56 to $351.06, representing a growth of approximately 58.7%. The stock has shown some volatility, with a 52-week range of $221.56 to $376.45. The average trading volume of 1,791,658 shares indicates a healthy level of investor interest, with recent trends suggesting a continued upward momentum.
Volume Analysis
Over the last three months, Cadence Design Systems has seen an increase in trading volumes, indicating a buyer-driven market. The average volume of 1,791,658 shares suggests strong investor interest, and the upward trend in volume supports the bullish sentiment surrounding the stock.
Analyst Opinions
Recent analyst recommendations for Cadence Design Systems have been predominantly positive, with many analysts rating the stock as a “buy.” The main arguments for this consensus include the company’s strong financial performance, innovative product offerings, and favorable market conditions. As of 2025, the consensus remains a “buy,” reflecting confidence in the company’s growth potential.
Consumer Opinions
Consumer feedback on Cadence Design Systems has been largely positive, with many users praising the effectiveness and reliability of its products. However, some users have expressed concerns regarding the complexity of certain tools and the learning curve associated with them.
Positive Reviews
Negative Reviews
Highly effective for complex designs.
Steep learning curve for new users.
Excellent customer support.
Some features are not intuitive.
Robust integration with other tools.
High cost for small businesses.
Risk Analysis
The following table outlines the main risks faced by Cadence Design Systems.
Risk Category
Description
Probability
Potential Impact
Recent Example / Fact
Financial
Fluctuations in revenue due to market demand.
Medium
High
N/A
Operational
Challenges in product development timelines.
Medium
Moderate
N/A
Sector
Intense competition in the EDA market.
High
High
N/A
Regulatory
Compliance with international trade regulations.
Medium
Moderate
N/A
Geopolitical
Impact of global political tensions on supply chains.
The most critical risks for investors include intense competition in the EDA market and the potential impact of rapid technological changes.
Summary
Cadence Design Systems has demonstrated strong financial performance, with consistent revenue growth and favorable financial ratios. The company’s competitive advantages, including a robust product portfolio and a commitment to innovation, position it well for future growth. However, investors should be aware of the risks associated with competition and technological changes.
Strengths
Weaknesses
Strong brand reputation.
No dividend payments.
Comprehensive product portfolio.
High P/E ratio.
Commitment to innovation.
Complexity of some products.
Should You Buy Cadence Design Systems?
Given the positive net margin, favorable long-term trend, and increasing buyer volumes, Cadence Design Systems appears to be a strong candidate for long-term investment. However, investors should remain cautious of the competitive landscape and potential technological disruptions.
Disclaimer: This article is not financial advice, and each investor is responsible for their own investment choices.