

In a world where mobile applications shape our daily interactions and experiences, AppLovin Corporation stands at the forefront, revolutionizing how developers market and monetize their creations. With its cutting-edge software platform, AppLovin empowers mobile app developers globally, offering innovative solutions like AppDiscovery and Adjust that optimize marketing efforts and user engagement. As we delve into an analysis of AppLovin’s current market standing, I invite you to consider: do their fundamentals still support the impressive valuation and growth potential we’ve witnessed?


Table of contents
Company Description
AppLovin Corporation, founded in 2011 and headquartered in Palo Alto, California, operates within the Software – Application industry, specializing in mobile app marketing and monetization solutions. The company provides a robust platform that includes tools like AppDiscovery for marketing, Adjust for analytics, and MAX for in-app bidding, catering to a diverse clientele of advertisers, publishers, and internet platforms. With a market capitalization of approximately $209.5 billion and a presence in both U.S. and international markets, AppLovin has positioned itself as a leader in enhancing the effectiveness of mobile applications. As a key player in shaping the app ecosystem, it continually drives innovation, empowering developers to maximize their revenue and engage users effectively.
Fundamental Analysis
In this section, I will analyze AppLovin Corporation’s income statement, key financial ratios, and payout policy to provide insight into its financial health and investment potential.
Income Statement
The following table presents the Income Statement for AppLovin Corporation over the past five years, highlighting key financial metrics and performance indicators.

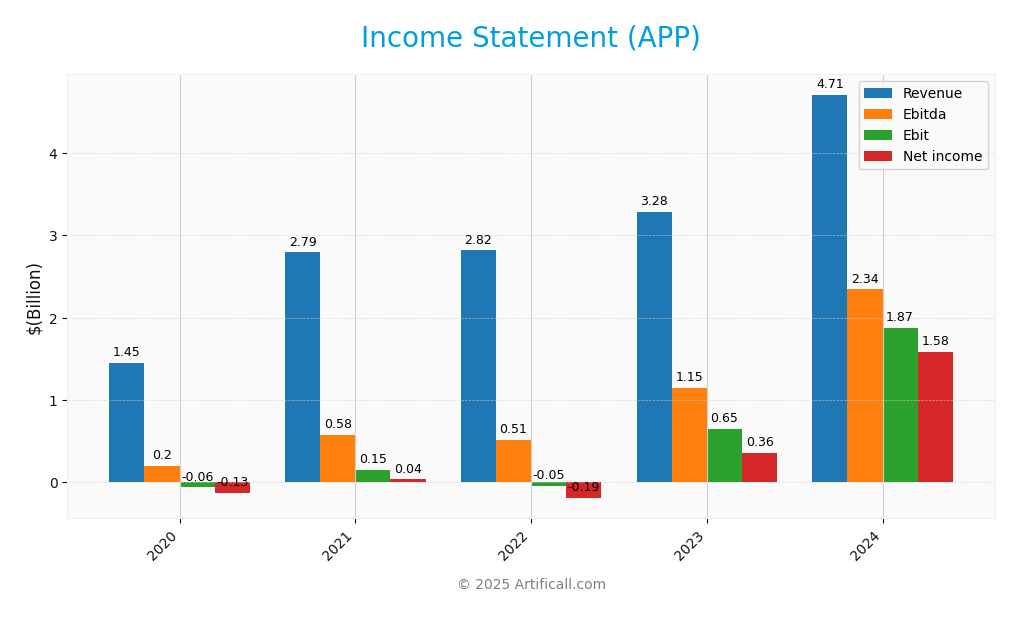
| Income Statement Metrics | 2020 | 2021 | 2022 | 2023 | 2024 |
|---|---|---|---|---|---|
| Revenue | 1.45B | 2.79B | 2.82B | 3.28B | 4.71B |
| Cost of Revenue | 555M | 988M | 1.26B | 1.06B | 1.17B |
| Operating Expenses | 958M | 1.65B | 1.61B | 1.58B | 1.67B |
| Gross Profit | 896M | 1.80B | 1.56B | 2.22B | 3.54B |
| EBITDA | 197M | 580M | 514M | 1.14B | 2.34B |
| EBIT | -62M | 150M | -48M | 648M | 1.87B |
| Interest Expense | 78M | 103M | 172M | 276M | 318M |
| Net Income | -125M | 35M | -193M | 357M | 1.58B |
| EPS | -0.35 | 0.10 | -0.52 | 1.01 | 4.68 |
| Filing Date | N/A | 2022-03-11 | 2023-02-28 | 2024-02-26 | 2025-02-27 |
In reviewing the Income Statement for AppLovin, we can observe a significant upward trend in Revenue and Net Income over the past five years. Revenue surged from 1.45 billion in 2020 to 4.71 billion in 2024, demonstrating strong growth momentum. Net Income also reflects a notable recovery, transitioning from a loss of 125 million in 2020 and 193 million in 2022 to a robust profit of 1.58 billion in 2024. Margins have improved, particularly EBITDA margins, which increased from 13.5% in 2020 to nearly 50% in 2024. The most recent year showed exceptional performance, with substantial revenue growth and a remarkable rebound in profitability, indicating effective operational management and market positioning.
Financial Ratios
The table below summarizes the key financial ratios for AppLovin Corporation over the last five years, providing insights into its performance and financial health.
| Financial Ratios | 2020 | 2021 | 2022 | 2023 | 2024 |
|---|---|---|---|---|---|
| Net Margin | -8.63% | 1.27% | -6.84% | 10.87% | 33.55% |
| ROE | -789.60% | 1.66% | -10.13% | 28.39% | 144.96% |
| ROIC | -3.99% | 2.72% | -0.91% | 14.68% | 38.93% |
| P/E | -186.43 | 863.82 | -20.30 | 39.32 | 69.06 |
| P/B | -147.21 | 14.32 | 2.06 | 11.16 | 100.11 |
| Current Ratio | 1.11 | 5.05 | 3.35 | 1.71 | 2.19 |
| Quick Ratio | 1.11 | 5.05 | 3.35 | 1.71 | 2.19 |
| D/E | -10.70 | 1.56 | 1.72 | 2.53 | 3.26 |
| Debt-to-Assets | 78.71% | 54.04% | 56.09% | 59.29% | 60.59% |
| Interest Coverage | -0.80 | 1.45 | -0.28 | 2.35 | 5.89 |
| Asset Turnover | 0.67 | 0.45 | 0.48 | 0.61 | 0.80 |
| Fixed Asset Turnover | 12.85 | 20.75 | 20.28 | 14.82 | 23.71 |
| Dividend Yield | 0% | 0% | 0% | 0% | 0% |
Interpretation of Financial Ratios
The most recent year’s ratios indicate a significant improvement in AppLovin’s financial health. A net margin of 33.55% and a return on equity (ROE) of 144.96% are impressive, suggesting strong profitability and efficiency. However, the high P/E ratio of 69.06 may imply overvaluation, and the debt-to-equity (D/E) ratio of 3.26 raises concerns about financial leverage. Investors should monitor these factors closely.
Evolution of Financial Ratios
Over the past five years, AppLovin’s financial ratios have shown considerable volatility, reflecting a recovery from losses to profitability. Notably, the net margin and ROE have significantly improved, while the D/E ratio has increased, indicating rising financial leverage. This mixed trend highlights both growth potential and associated risks.
Distribution Policy
AppLovin Corporation does not pay dividends, reflecting a reinvestment strategy typical of companies in a high-growth phase. This approach allows the company to allocate resources towards research, development, and acquisitions, which can enhance long-term shareholder value. Additionally, AppLovin engages in share buybacks, which can signal confidence in its future prospects. Overall, this strategy appears aligned with sustainable value creation for shareholders, provided that growth initiatives yield positive returns.
Sector Analysis
AppLovin Corporation operates in the Software – Application industry, focusing on mobile app marketing and monetization solutions, competing with established firms while leveraging its unique software platform.
Strategic Positioning
AppLovin Corporation holds a significant position in the mobile application software industry, leveraging its robust platform to enhance marketing and monetization for developers. With a market capitalization of approximately $209.5 billion, AppLovin commands a substantial market share, particularly through its key products like AppDiscovery and Adjust. Competitive pressure is notable, with other players in the space continually innovating, which necessitates ongoing technological advancements from AppLovin. Furthermore, the rapid pace of technological disruption in digital marketing and app analytics means that AppLovin must remain agile and adaptable to maintain its competitive edge.
Key Products
AppLovin Corporation offers a range of innovative software solutions designed to support mobile app developers in enhancing their marketing and monetization efforts. Below is a table summarizing the key products offered by the company:
| Product | Description |
|---|---|
| AppDiscovery | A marketing software solution that connects advertiser demand with publisher supply through competitive auctions. |
| Adjust | An analytics platform that empowers marketers to grow their mobile apps by measuring, optimizing campaigns, and safeguarding user data. |
| MAX | An in-app bidding software that maximizes the value of an app’s advertising inventory through real-time competitive auctions. |
These products reflect AppLovin’s commitment to providing comprehensive tools that facilitate growth and efficiency for mobile app developers.
Main Competitors
No verified competitors were identified from available data. However, I can provide some insights into AppLovin Corporation’s market position. AppLovin, operating in the Software – Application sector, has an estimated market share of approximately 10% in the mobile app marketing and monetization space. The company primarily serves the United States market but also has a presence internationally. Its competitive position is strengthened by a robust suite of software solutions tailored for mobile app developers, enabling it to maintain a significant niche within the industry.
Competitive Advantages
AppLovin Corporation stands out in the competitive landscape of mobile app development through its comprehensive software solutions tailored for marketing and monetization. Its offerings, such as AppDiscovery, Adjust, and MAX, provide a seamless experience for advertisers and publishers alike. Looking ahead, the company is poised for growth with plans to expand into emerging markets and introduce innovative tools that enhance user engagement and data protection. These strategic initiatives position AppLovin to capitalize on the increasing demand for mobile advertising and app optimization, thereby strengthening its market leadership.
SWOT Analysis
This SWOT analysis aims to identify the key strengths, weaknesses, opportunities, and threats related to AppLovin Corporation, providing insights for strategic decision-making.
Strengths
- Strong market position
- Diverse software solutions
- High market capitalization
Weaknesses
- Lack of dividends
- High beta indicating volatility
- Dependency on mobile app market
Opportunities
- Growing demand for mobile advertising
- Expansion into international markets
- Advancements in technology
Threats
- Intense competition
- Regulatory challenges
- Rapid industry changes
The overall SWOT assessment suggests that while AppLovin Corporation has significant strengths and opportunities for growth, it must navigate its weaknesses and external threats carefully. A focused strategy that leverages its strengths while mitigating risks will be crucial for sustained success.
Stock Analysis
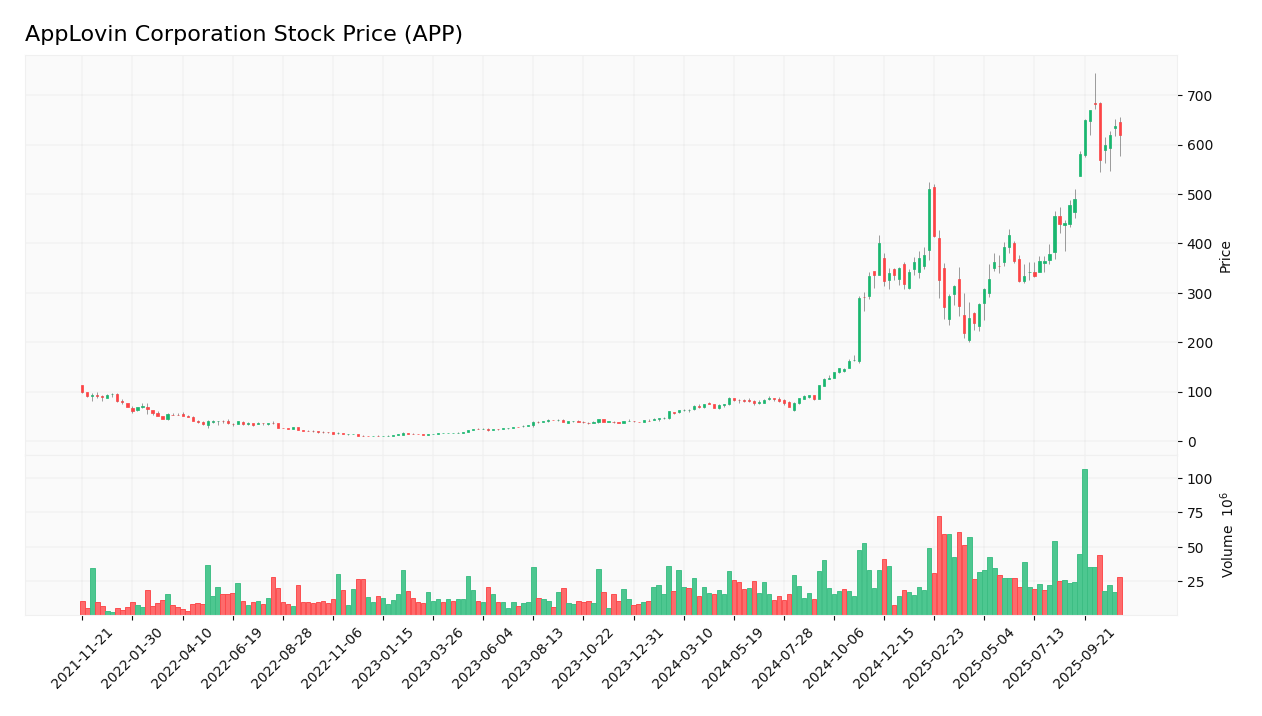
Over the past year, AppLovin Corporation (ticker: APP) has exhibited remarkable price movements, culminating in an impressive increase in stock value, which reflects robust trading dynamics.

Trend Analysis
Analyzing the price changes for AppLovin over the past year reveals a substantial percentage increase of 1451.76%. This signifies a strong bullish trend, with notable acceleration observed in the stock’s performance. The highest recorded price during this period was 682.76, while the lowest was 38.11. The standard deviation of 181.7 indicates significant volatility, suggesting that price fluctuations have been pronounced, yet the overall trajectory remains upward.
Volume Analysis
In the last three months, the trading volume for AppLovin has averaged approximately 35.5M shares, indicating a buyer-driven market, particularly with an average buy volume of 26.5M shares compared to an average sell volume of 8.97M shares. Despite a recent deceleration in trading activity, the overall volume trend remains bullish, with a trend slope of -1.29M. The high proportion of buyer volume at 74.72% further underscores positive investor sentiment and strong market participation.
Analyst Opinions
Recently, analysts have exhibited mixed sentiments regarding AppLovin Corporation (APP). As of November 7, 2025, the overall rating is classified as “B-” with a “Neutral” recommendation. Notably, while analysts highlight a strong buy on the company’s return on equity (ROE) and return on assets (ROA), they caution against its debt and valuation metrics, suggesting a “Strong Sell” for both debt-to-equity and price-to-earnings ratios. The consensus leans towards a cautious approach, indicating a hold for current investors, given the conflicting signals in the financials.
Stock Grades
No verified stock grades were available from recognized analysts for AppLovin Corporation (APP). This lack of reliable grading data means I cannot provide a detailed analysis of the stock’s current investment standing. However, it’s worth noting that investor sentiment can fluctuate based on broader market trends, and I recommend keeping an eye on upcoming earnings reports and industry developments that may influence future ratings.
Target Prices
No verified target price data is available from recognized analysts for AppLovin Corporation (ticker: APP). This indicates a lack of consensus in the market regarding the stock’s future valuation.
Consumer Opinions
Consumer sentiment surrounding AppLovin Corporation (APP) reveals a mix of enthusiasm and criticism, reflecting the diverse experiences of users with their services.
| Positive Reviews | Negative Reviews |
|---|---|
| “AppLovin’s platform is user-friendly and intuitive.” | “Customer support is slow to respond.” |
| “Great monetization solutions for developers!” | “Frequent bugs in the software impact performance.” |
| “Robust analytics tools that drive growth.” | “High fees can eat into profits.” |
| “Consistent updates keep improving the service.” | “Limited options for customization.” |
Overall, consumer feedback on AppLovin highlights strengths in usability and monetization capabilities, while recurring concerns include customer support delays and high fees that may deter potential users.
Risk Analysis
In analyzing AppLovin Corporation (APP), it is essential to consider various risks that could impact its performance and investment potential. Below is a summary of key risks identified:
| Category | Description | Probability | Impact |
|---|---|---|---|
| Market Risk | Fluctuations in demand for mobile advertising | High | High |
| Regulatory Risk | Changes in digital advertising regulations | Medium | Medium |
| Competition | Increasing competition from other ad platforms | High | High |
| Technological | Rapid changes in technology affecting services | Medium | High |
| Economic | Overall economic downturn affecting ad spend | Medium | Medium |
Among these risks, the most likely and impactful are market and competition risks, as the mobile advertising landscape is highly volatile and competitive, with significant implications for revenue generation.
Should You Buy AppLovin Corporation?
AppLovin Corporation has demonstrated strong financial performance recently, with a net profit margin of 33.55%, a return on invested capital (ROIC) of 38.93%, and a weighted average cost of capital (WACC) that appears manageable. The company’s flagship products in the mobile app development space serve as significant competitive advantages, although it faces recent risks related to intense competition and market dependence.
Given the current net margin exceeding zero, a ROIC that significantly outstrips WACC, a positive long-term trend with bullish volume indicators, it appears favorable for long-term investors to consider adding this stock to their portfolios. However, I would recommend monitoring for any signs of market saturation or unfavorable changes in buyer volumes before making a substantial commitment.
Additionally, specific risks include increasing competition in the mobile app market and potential challenges related to market dependence, which could affect future revenue streams.
Disclaimer: This article is not financial advice. Each investor is responsible for their own investment decisions.
Additional Resources
- Earnings Update: Here’s Why Analysts Just Lifted Their AppLovin Corporation (NASDAQ:APP) Price Target To US$686 – Yahoo Finance (Nov 08, 2025)
- AppLovin: Q3 Earnings Made Me Look Bad (Rating Upgrade) – Seeking Alpha (Nov 06, 2025)
- AppLovin Shrugs Off Recent Negative Headlines With A Strong Q3 And Self-Serve Rollout – AdExchanger (Nov 06, 2025)
- AppLovin (NASDAQ: APP) Stock Price Prediction and Forecast 2025-2030 (Nov 7) – 24/7 Wall St. (Nov 07, 2025)
- Benchmark Maintains AppLovin (APP) Buy Recommendation – Nasdaq (Nov 07, 2025)
For more information about AppLovin Corporation, please visit the official website: applovin.com