Improving your trading performances using Divergences
A divergence happens when some technical indicators contradict the price movement. That allows for anticipating a trend reversal. This post will show …

The Range Breaker indicator is designed to seize the best trading opportunities. It detects all range breakouts, often followed by explosive price movements. The indicator works with all brokers accepting the Prorealtime platform.
Never miss a breakout again!
Get the Indicator

I created Artificall.com to help you to find a profitable trading strategy using Prorealtime.
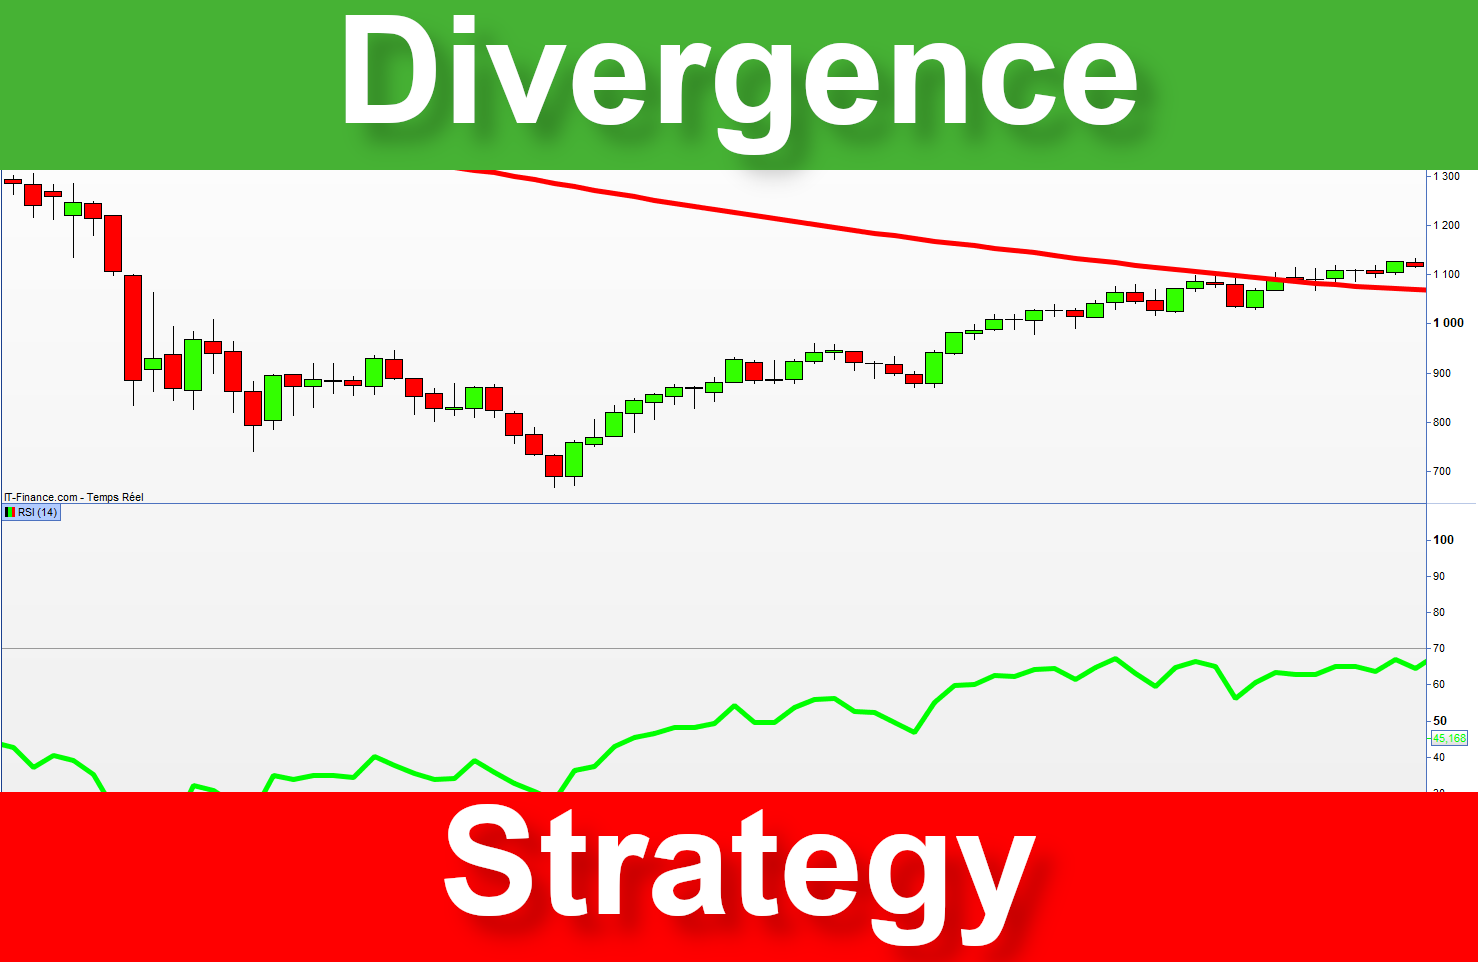
A divergence happens when some technical indicators contradict the price movement. That allows for anticipating a trend reversal. This post will show …
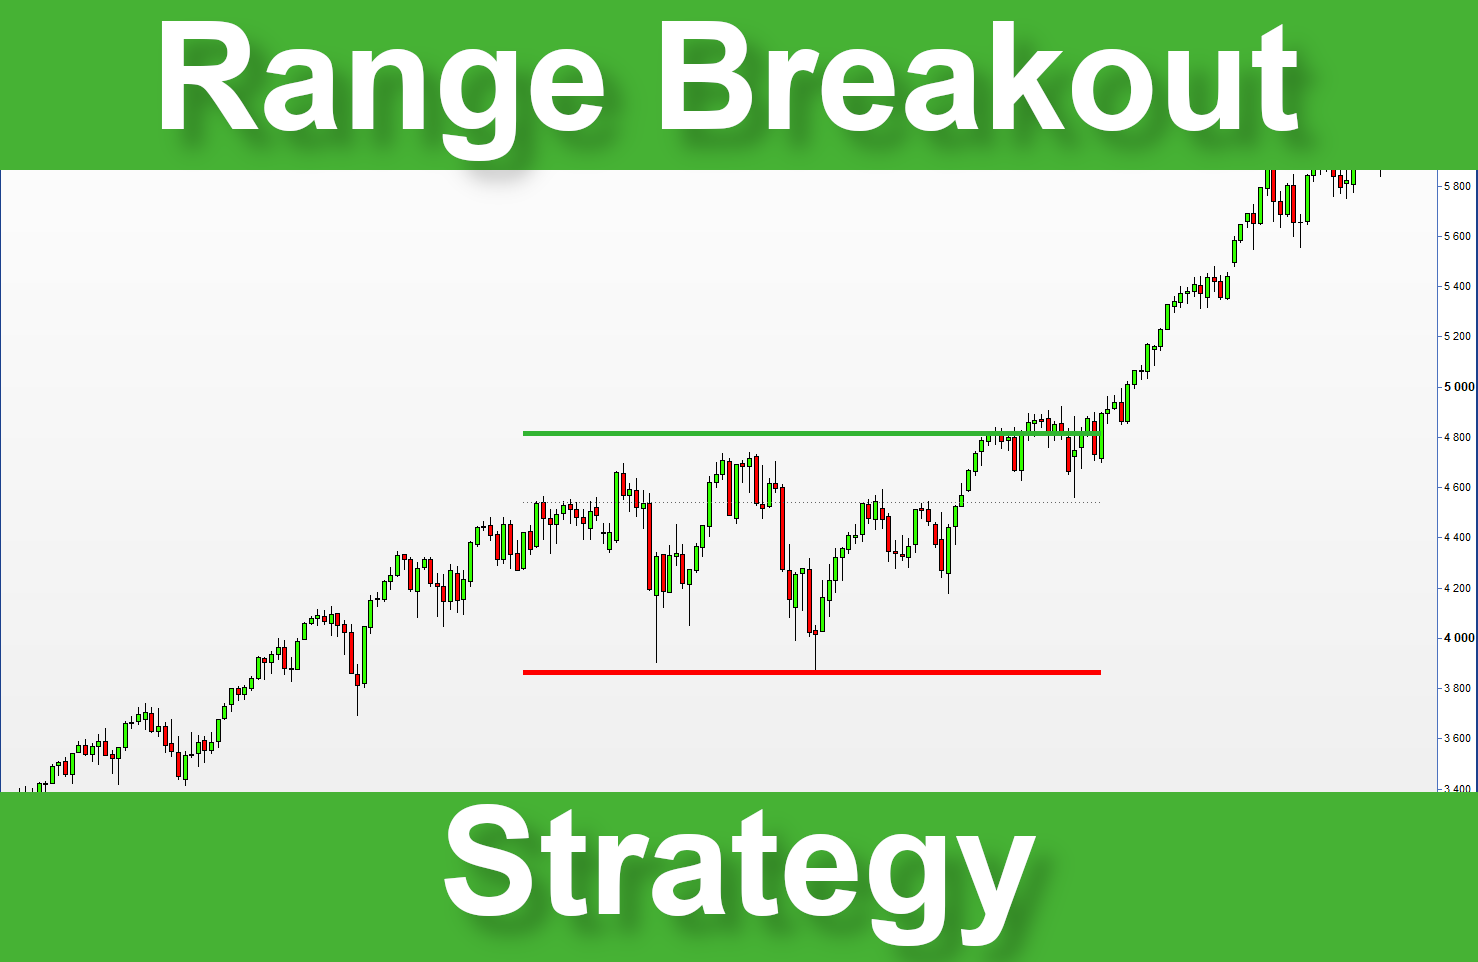
The opening range breakout is one of the most known trading strategies. That consists of opening an entry after the price of an asset crosses a key le…

Pullback buying is one of my preferred trading strategies. That consists of opening a long entry after a moderate market decrease in a solid long-term…
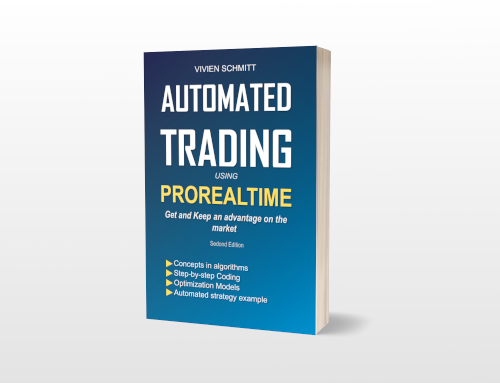
The second edition of my ebook is available! It is a complete revision of the previous version, representing a real improvement for the reader. Most chapters have been rewritten, and many new thematics have been appended.
The Range Breaker indicator is designed to seize the best trading opportunities. It detects all range breakouts, often followed by explosive price movements. The indicator works with all brokers accepting the Prorealtime platform.
Never miss a breakout again!
Get the Indicator